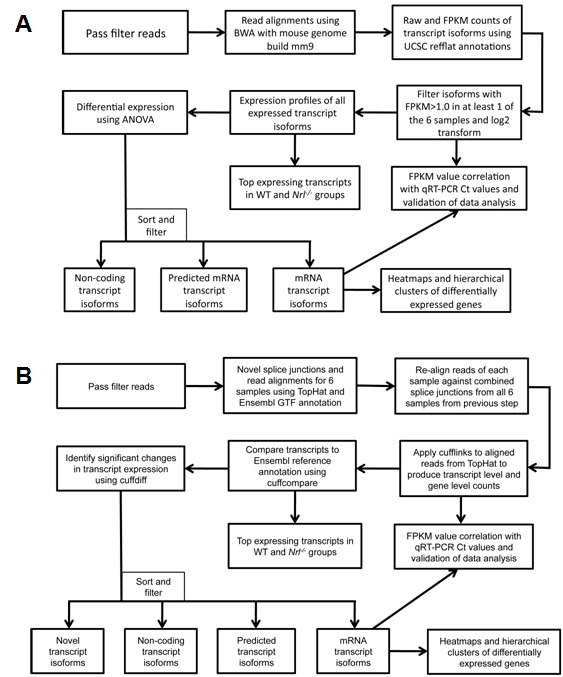
Figure 1. Flowchart of RNA-seq data
analysis methodology using Burrows-Wheeler Aligner (BWA) and
TopHat. Schematic representation of two RNA-seq data analysis
workflows and resulting views of the data generated.
A:
BWA workflow: Gapped alignments are performed using the BWA
algorithm against the mouse reference genome build mm9, and
estimation of the expression of genes at the transcript isoform
level is performed by importing aligned reads into the Partek
Genomics Suite using annotations provided by the University of
California Santa Cruz (
UCSC)
refflat.txt file. Transcripts expressed at low levels in all
samples (<1 fragments per kilobase of exon model per million
mapped reads [FPKM]) are filtered out. Differential expression
analysis was performed by applying the ANOVA (ANOVA) method, and
the resulting list was sorted and filtered into different
transcript groups. Clustering of rod and cone enriched genes was
performed using Cluster 3.0 software (see Methods).
B:
TopHat workflow: Splice junction mapping was performed using the
TopHat algorithm in two phases. In the first phase, splice
junctions were detected de novo from the reads from each sample
and combined to obtain a master splice junctions list. In the
second phase of TopHat alignment, reads from each sample were
re-aligned by providing the master junctions list as input. The
two-phase mapping approach significantly increased the number of
alignments spanning the splice junctions. Estimation of gene
expression and differential expression were computed using
Cufflinks, Cuffcompare, and Cuffdiff. Sorting and filtering of
transcript isoforms were performed as in the BWA workflow.
 Figure 1
of Brooks, Mol Vis 2011; 17:3034-3054.
Figure 1
of Brooks, Mol Vis 2011; 17:3034-3054.