Figure 5. Quantification of positive
immunohistochemical staining. Graphs showing quantification of
immuno-positive cells for (A) apoptosis (TUNEL), (B)
inflammatory cells (CD11b) showing differential staining in
central (black columns) and areas peripheral to the laser
dissection (white columns), (C) proliferating cells
(Ki67) and (D) fibroblastic cells (CD90) over 4, 24, 72
h, and 1 week after FSL (femtosecond laser) keratotomy. Error
bars indicate standard deviation.
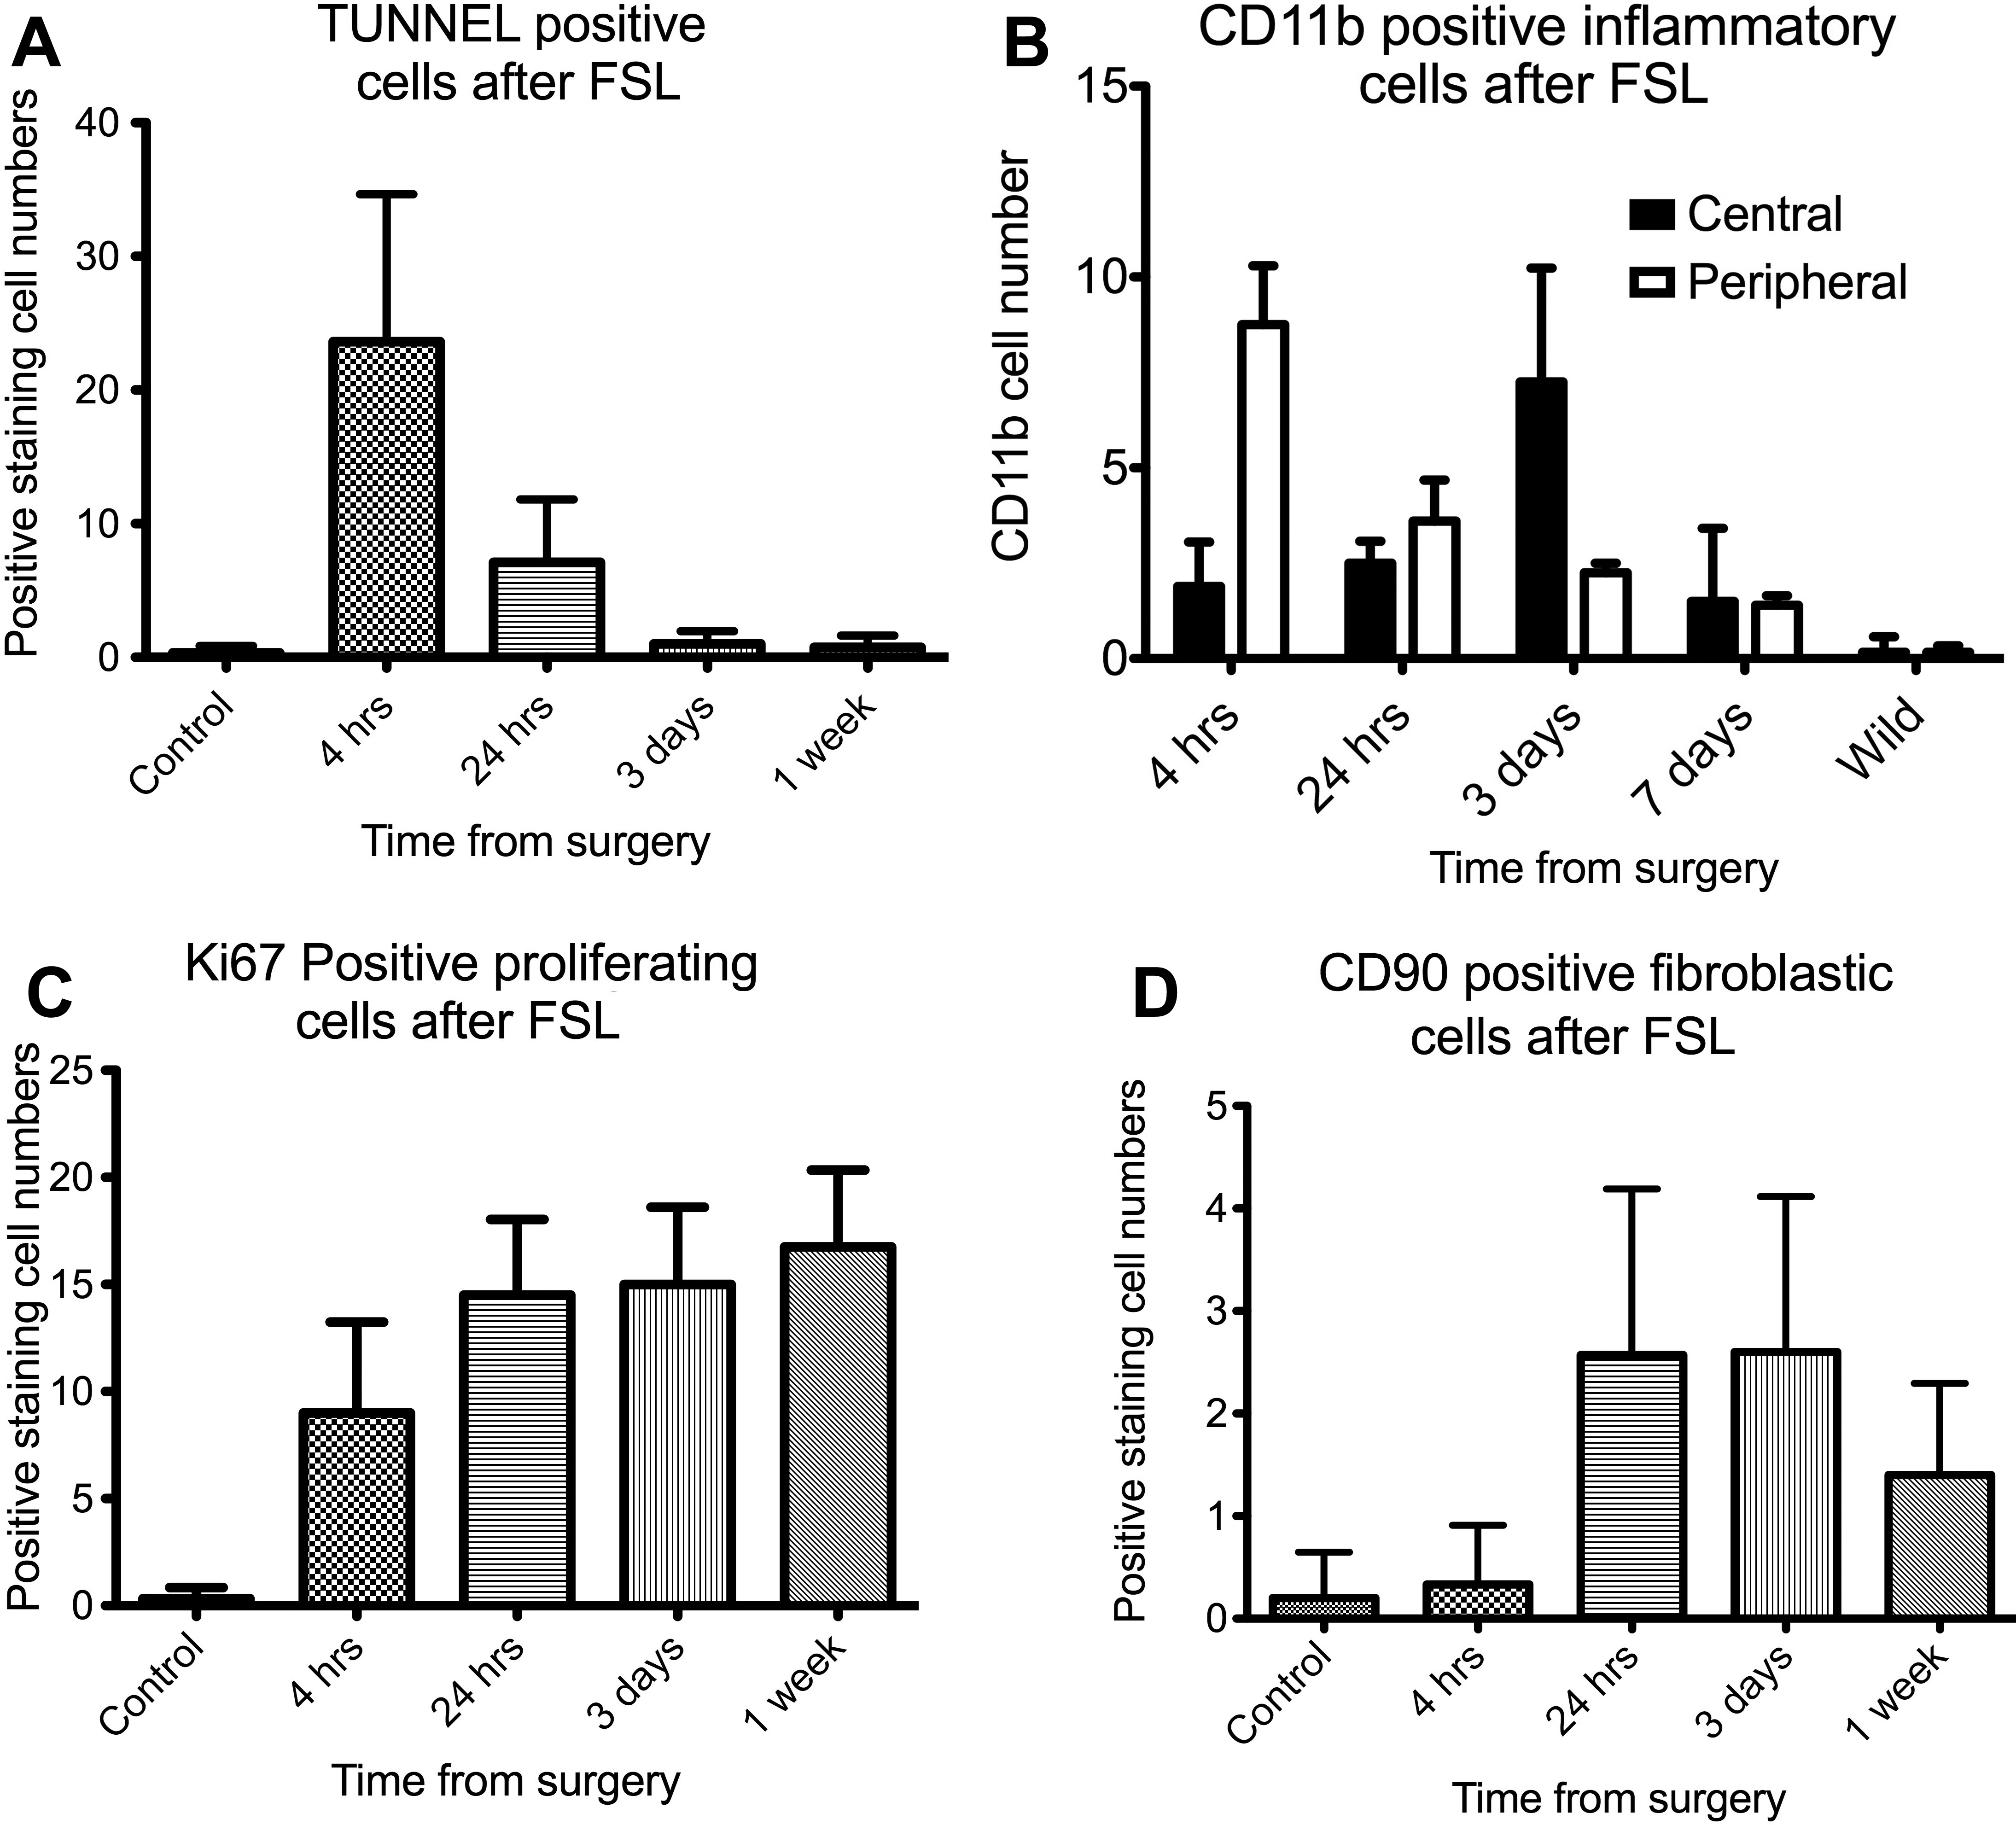
 Figure 5
of Angunawela, Mol Vis 2011; 17:3005-3012.
Figure 5
of Angunawela, Mol Vis 2011; 17:3005-3012.