Figure 4. Immunohistochemistry of mouse corneas at various time points. Representative images of immuno-positive staining (green arrows
indicate positively staining cells) for (A) apoptotic/TUNEL positive cells at 4 h, central cornea. B: CD11b positive inflammatory cells, peripheral cornea at 4 h and (C) CD11b in the central cornea at 4 h. D: Ki67 positive proliferating cells at 1 week and (E) shows CD90 positive fibroblastic cells at 1 week. E: TUNEL staining in a wild type uninjured mouse cornea, 3 positively staining epithelial cells are indicated. Cell nuclei
were stained with DAPI. These image time points were chosen as they represented maximal staining for the particular marker.
Epithelial separation occurred in some samples during cryosection and the displaced epithelium is indicated by the red arrows
to aid orientation. Scale bar is 50 µm.
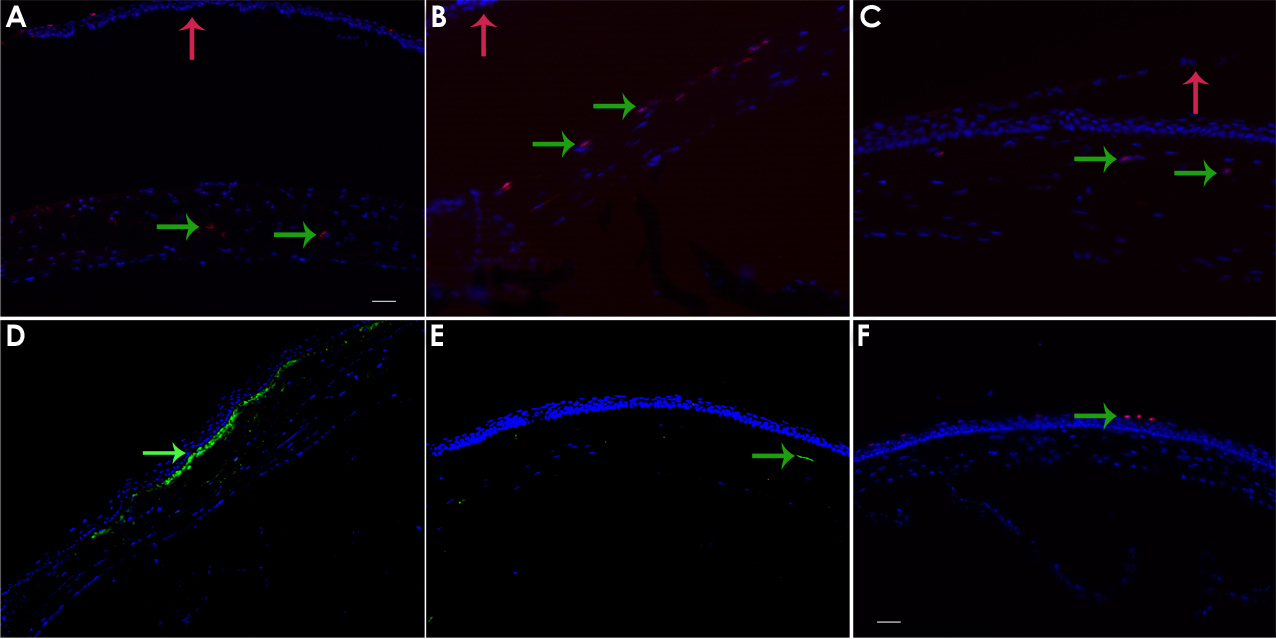
 Figure 4 of
Angunawela, Mol Vis 2011; 17:3005-3012.
Figure 4 of
Angunawela, Mol Vis 2011; 17:3005-3012.