Figure 2. Transmission electron
micrographs (TEM) of the stroma within the area of the
femtosecond laser keratotomy. An individual cavitation is
highlighted (A, arrow). In the same image, epithelium is
seen superiorly (dark area containing cell contents). B:
An individual cavitation in greater detail. C: Streaks
consistent with laser pulses within the stroma, note that the
separation between streaks is roughly 5 microns.
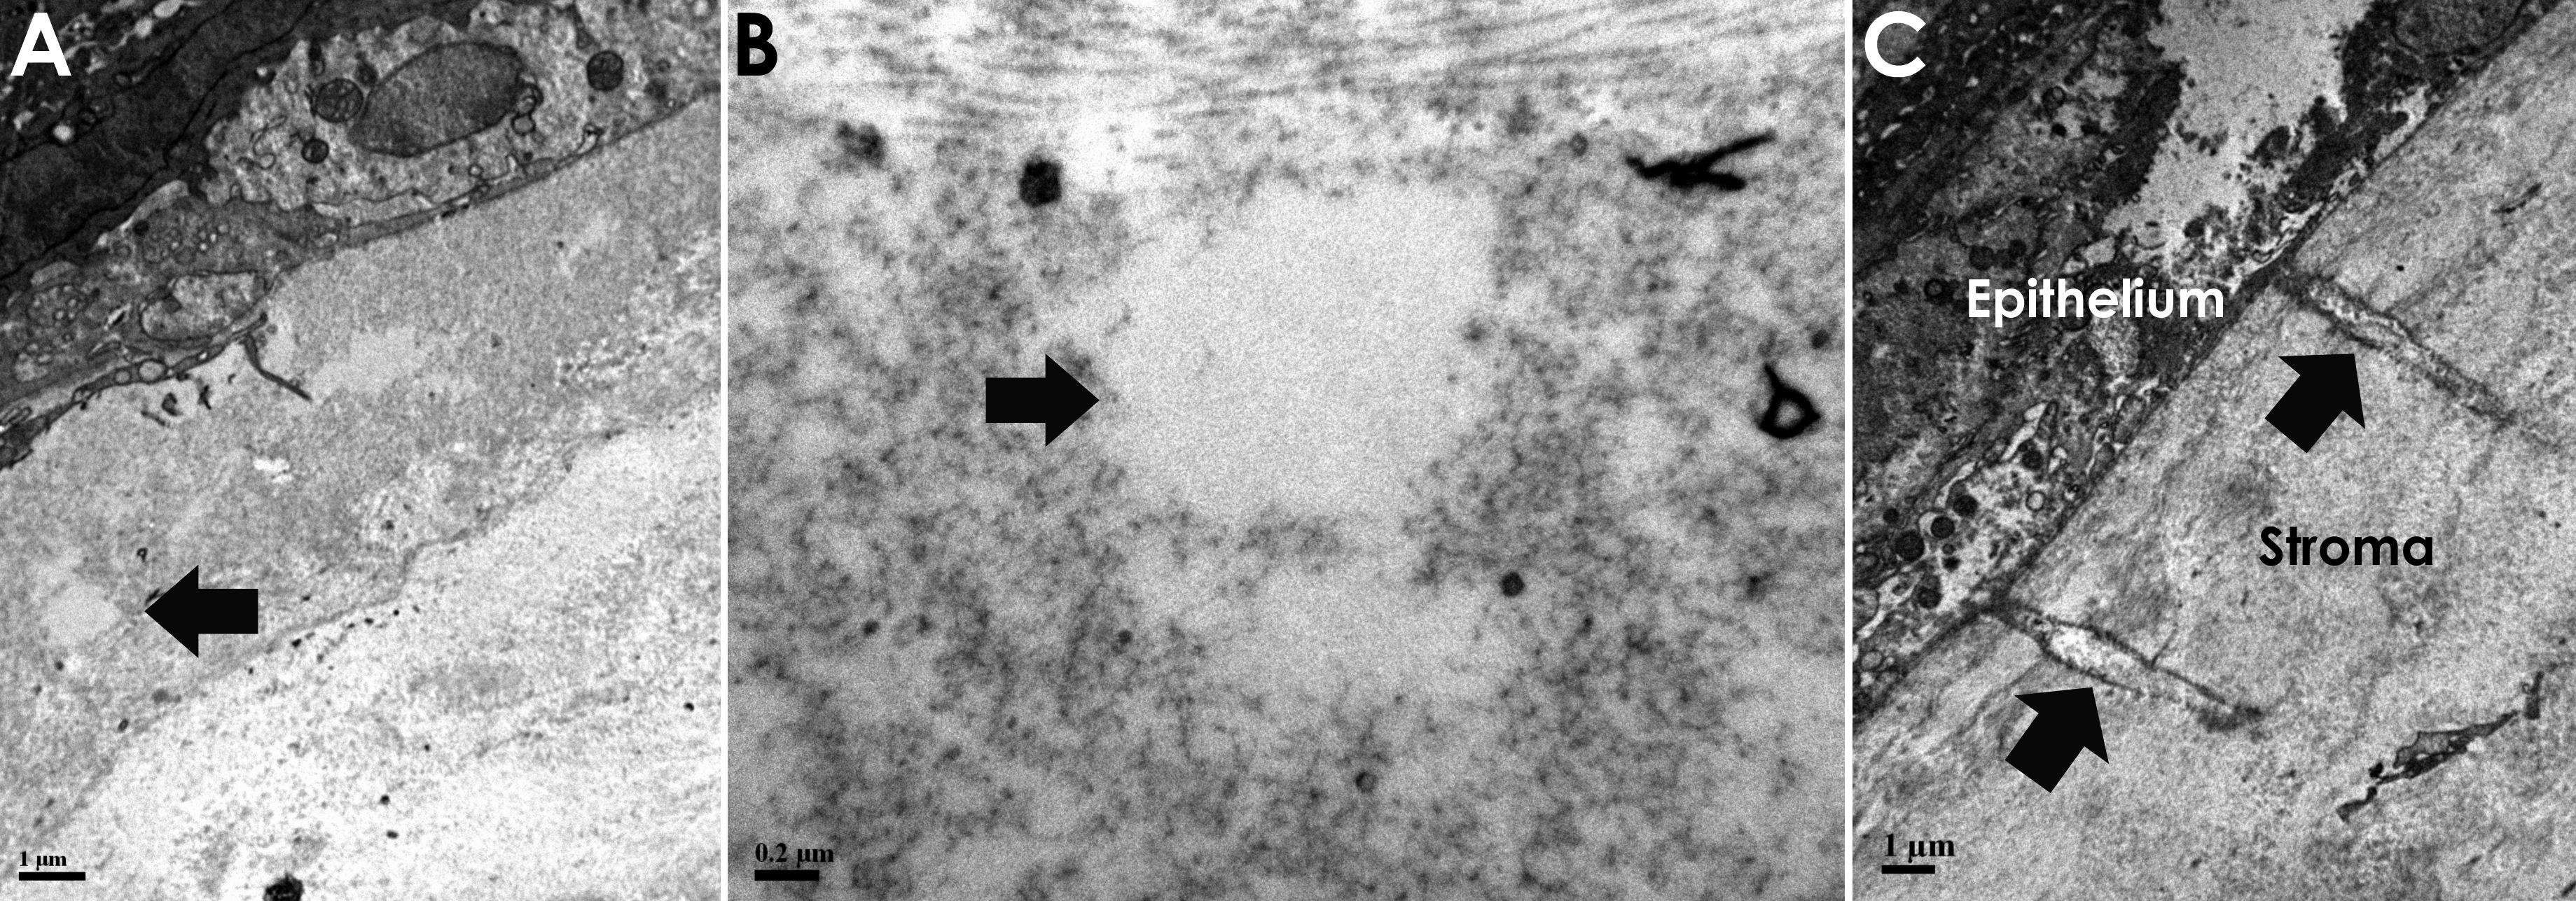
 Figure 2
of Angunawela, Mol Vis 2011; 17:3005-3012.
Figure 2
of Angunawela, Mol Vis 2011; 17:3005-3012.