Figure 2 of
Zanon-Moreno, Mol Vis 2011; 17:2997-3004.
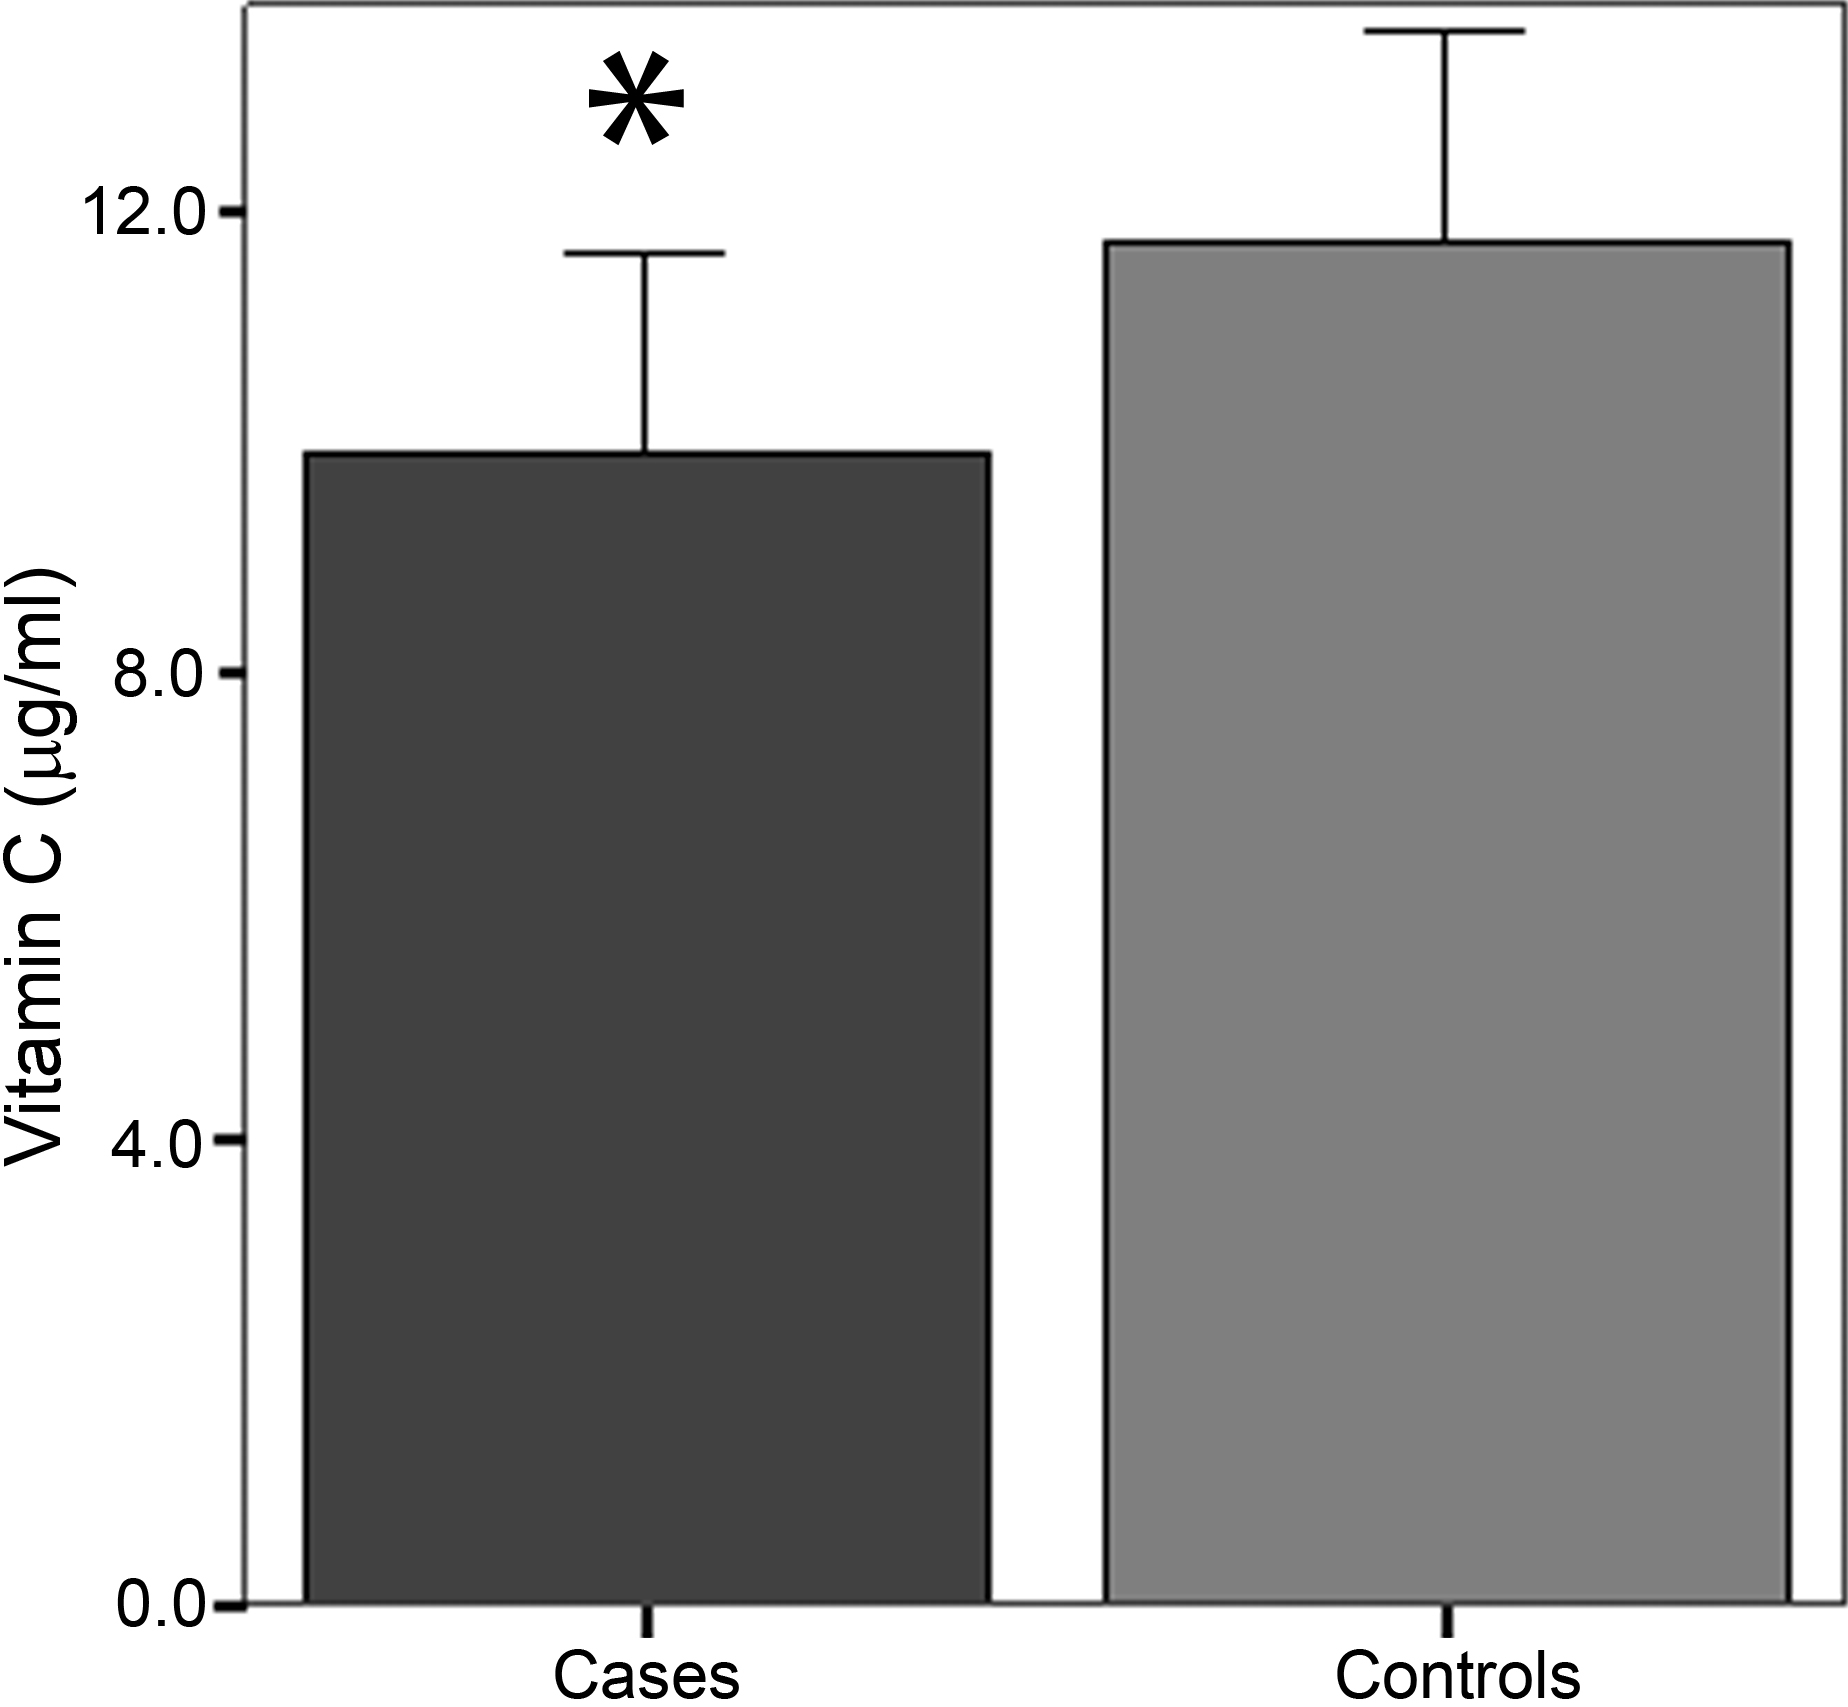
Figure 2.
Plasma concentrations of vitamin C (µg/ml) in POAG cases and controls. *Statistically significant (p<0.0125) differences of means between cases and controls.
 Figure 2
of Zanon-Moreno, Mol Vis 2011; 17:2997-3004.
Figure 2
of Zanon-Moreno, Mol Vis 2011; 17:2997-3004.