Figure 5. Overexpression of hFRMD7-FL
stimulates hFRMD7-S transcription. Expression levels of hFRMD7-FL
or hFRMD7-S transcripts were monitored by RT-qPCR in
transfected NT2 cells at the indicated time points. Cells
transfected with the empty vector served as the negative control
(MOCK group). A: Expression levels of hFRMD7-S in
NT2 cells overexpressing hFRMD7-FL. B: Expression
levels of hFRMD7-FL in NT2 cells overexpressing hFRMD7-S.
The primer sets were used for RT-qPCR: p1f/p1r, p2f/p2r and
p3f/p3r. Both the transcript levels are normalized to GAPDH
mRNA levels. The data are presented as the fold changes relative
to MOCK group. All of the experiments were done in triplicate,
and the graph represents the average (columns, mean; bars,
S.E.M.; *p<0.05, **p<0.01 versus MOCK group).
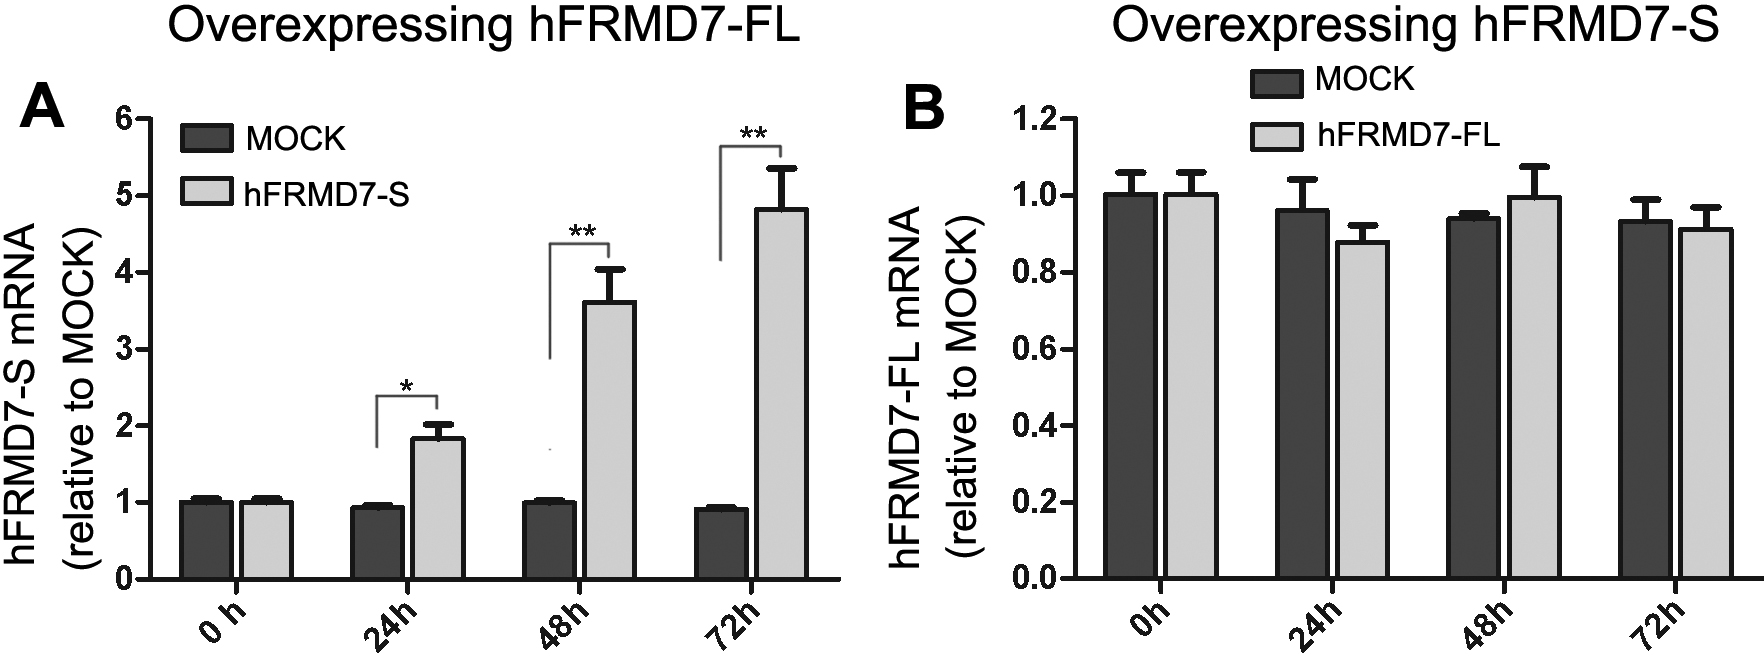
 Figure 5
of Li, Mol Vis 2011; 17:2986-2996.
Figure 5
of Li, Mol Vis 2011; 17:2986-2996.