Figure 2. Effects of ATRA/BMP-2
induction on the expression of FRMD7 splice variants in
NT2 cells. A and B: NT2 cells were treated with
ATRA (10 µM) or vehicle (0.1% DMSO) for the indicated periods. C
and D: NT2 cells were treated with BMP-2 (50 ng/ml) or
vehicle (normal saline) for the indicated time periods.
Expression levels of hFRMD7-FL and hFRMD7-S
transcripts were determined by RT-qPCR. The vehicle-treated
cells did not show any significant change (data not shown). The
primer sets were used for RT-qPCR: p1f/p1r, p2f/p2r and p3f/p3r.
Both the transcript levels are normalized to GAPDH mRNA
levels. The data are presented as fold changes relative to 0 h.
The experiments were done in triplicate, and the graphs
represent the average of three independent experiments (Columns,
mean; bars, S.E.M.; *p<0.05, **p<0.01 versus 0 h).
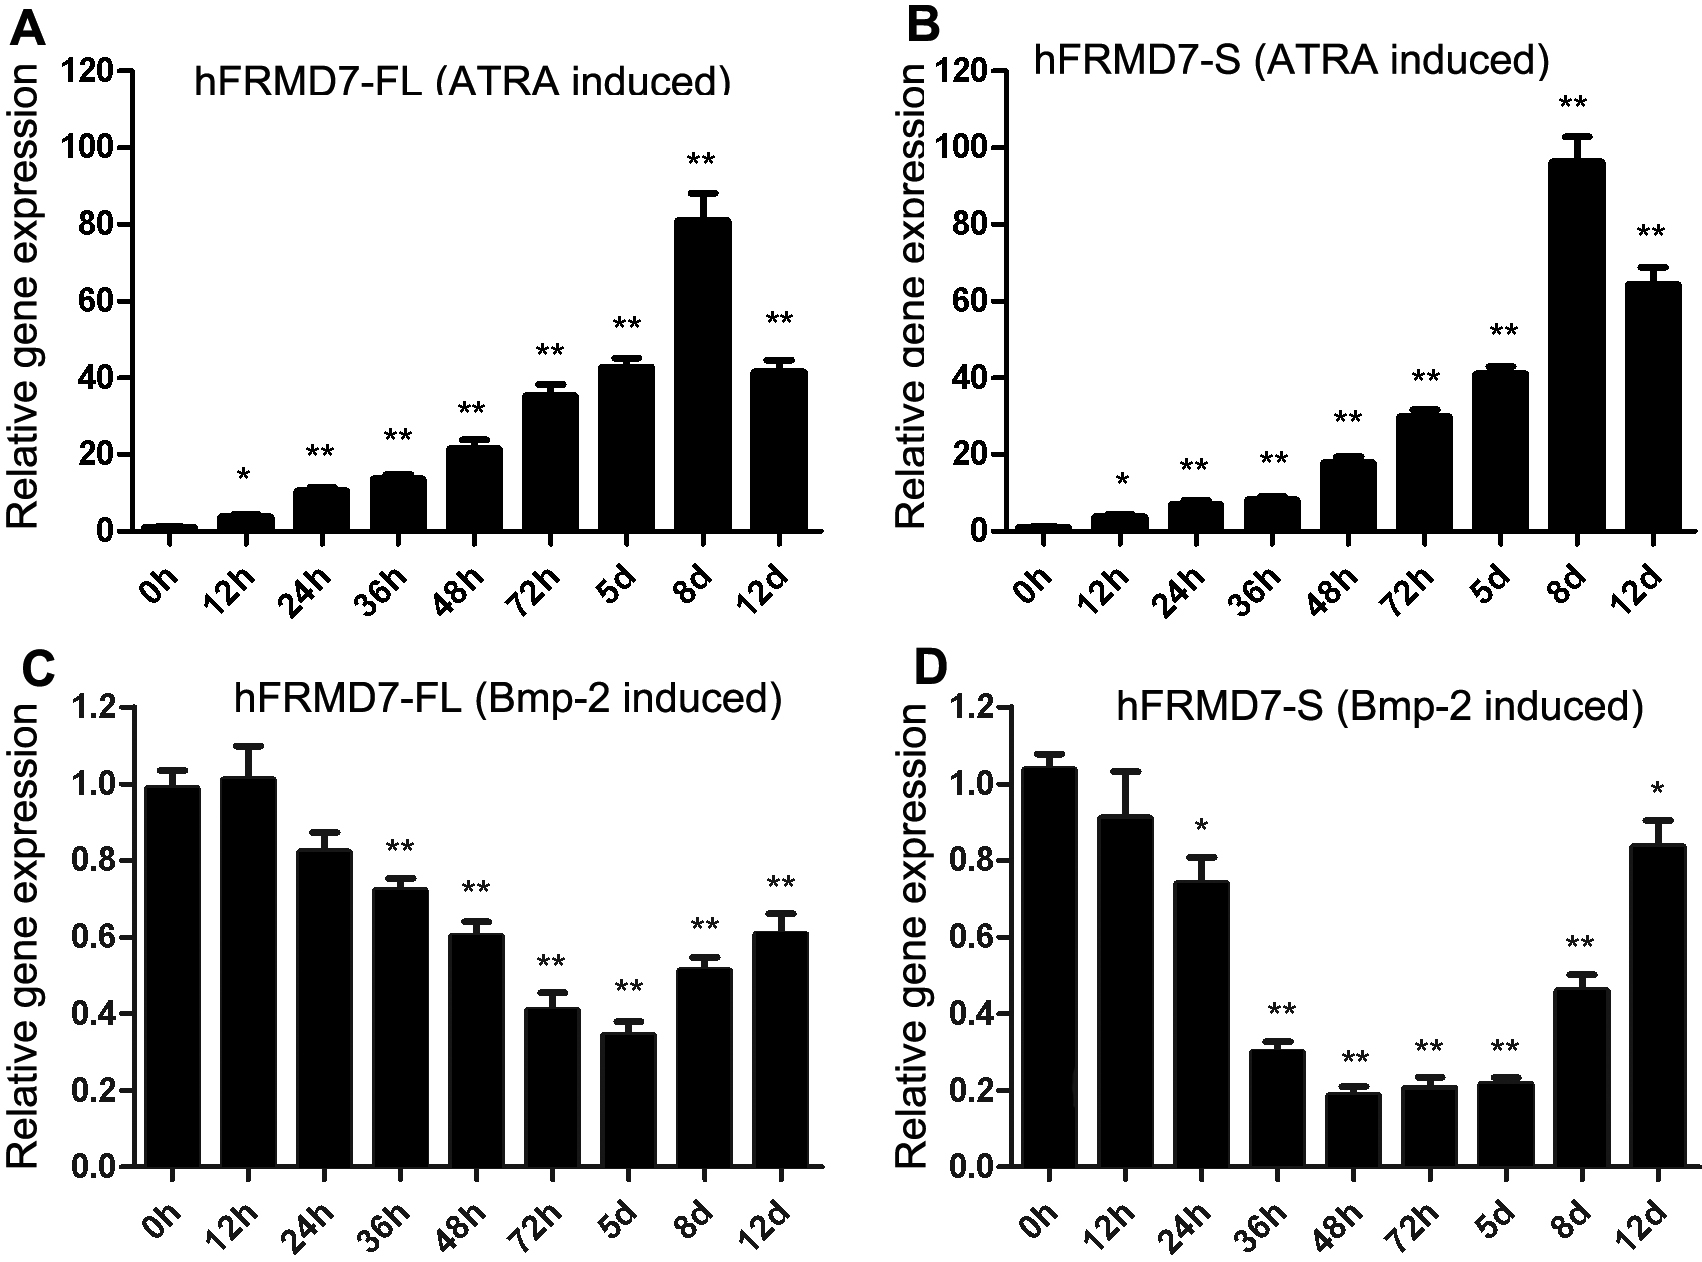
 Figure 2
of Li, Mol Vis 2011; 17:2986-2996.
Figure 2
of Li, Mol Vis 2011; 17:2986-2996.