Figure 3. Effect of 60 mmHg
hydrostatic pressure on ZO-1 in TM cells after 24 h. ZO-1 was
immunolabeled with FITC and the nucleus was immunolabeled with
hoechst, and observed under a confocal microscope, using
identical parameters. The ZO-1 distribution in iHTM is clearly
and regular, while that in GTM3 is irregular and
tangled. Cells under 60 mmHg hydrostatic pressure showed
significant decreased and irregular distribution of ZO-1 in both
iHTM and GTM3 . The blank group showed that PBS was
used instead of mouse antibody against ZO-1, other steps are the
same. Every picture involved in the figure is the Z-depth slide
that contain most green fluorescence (scale bar=10 µm).
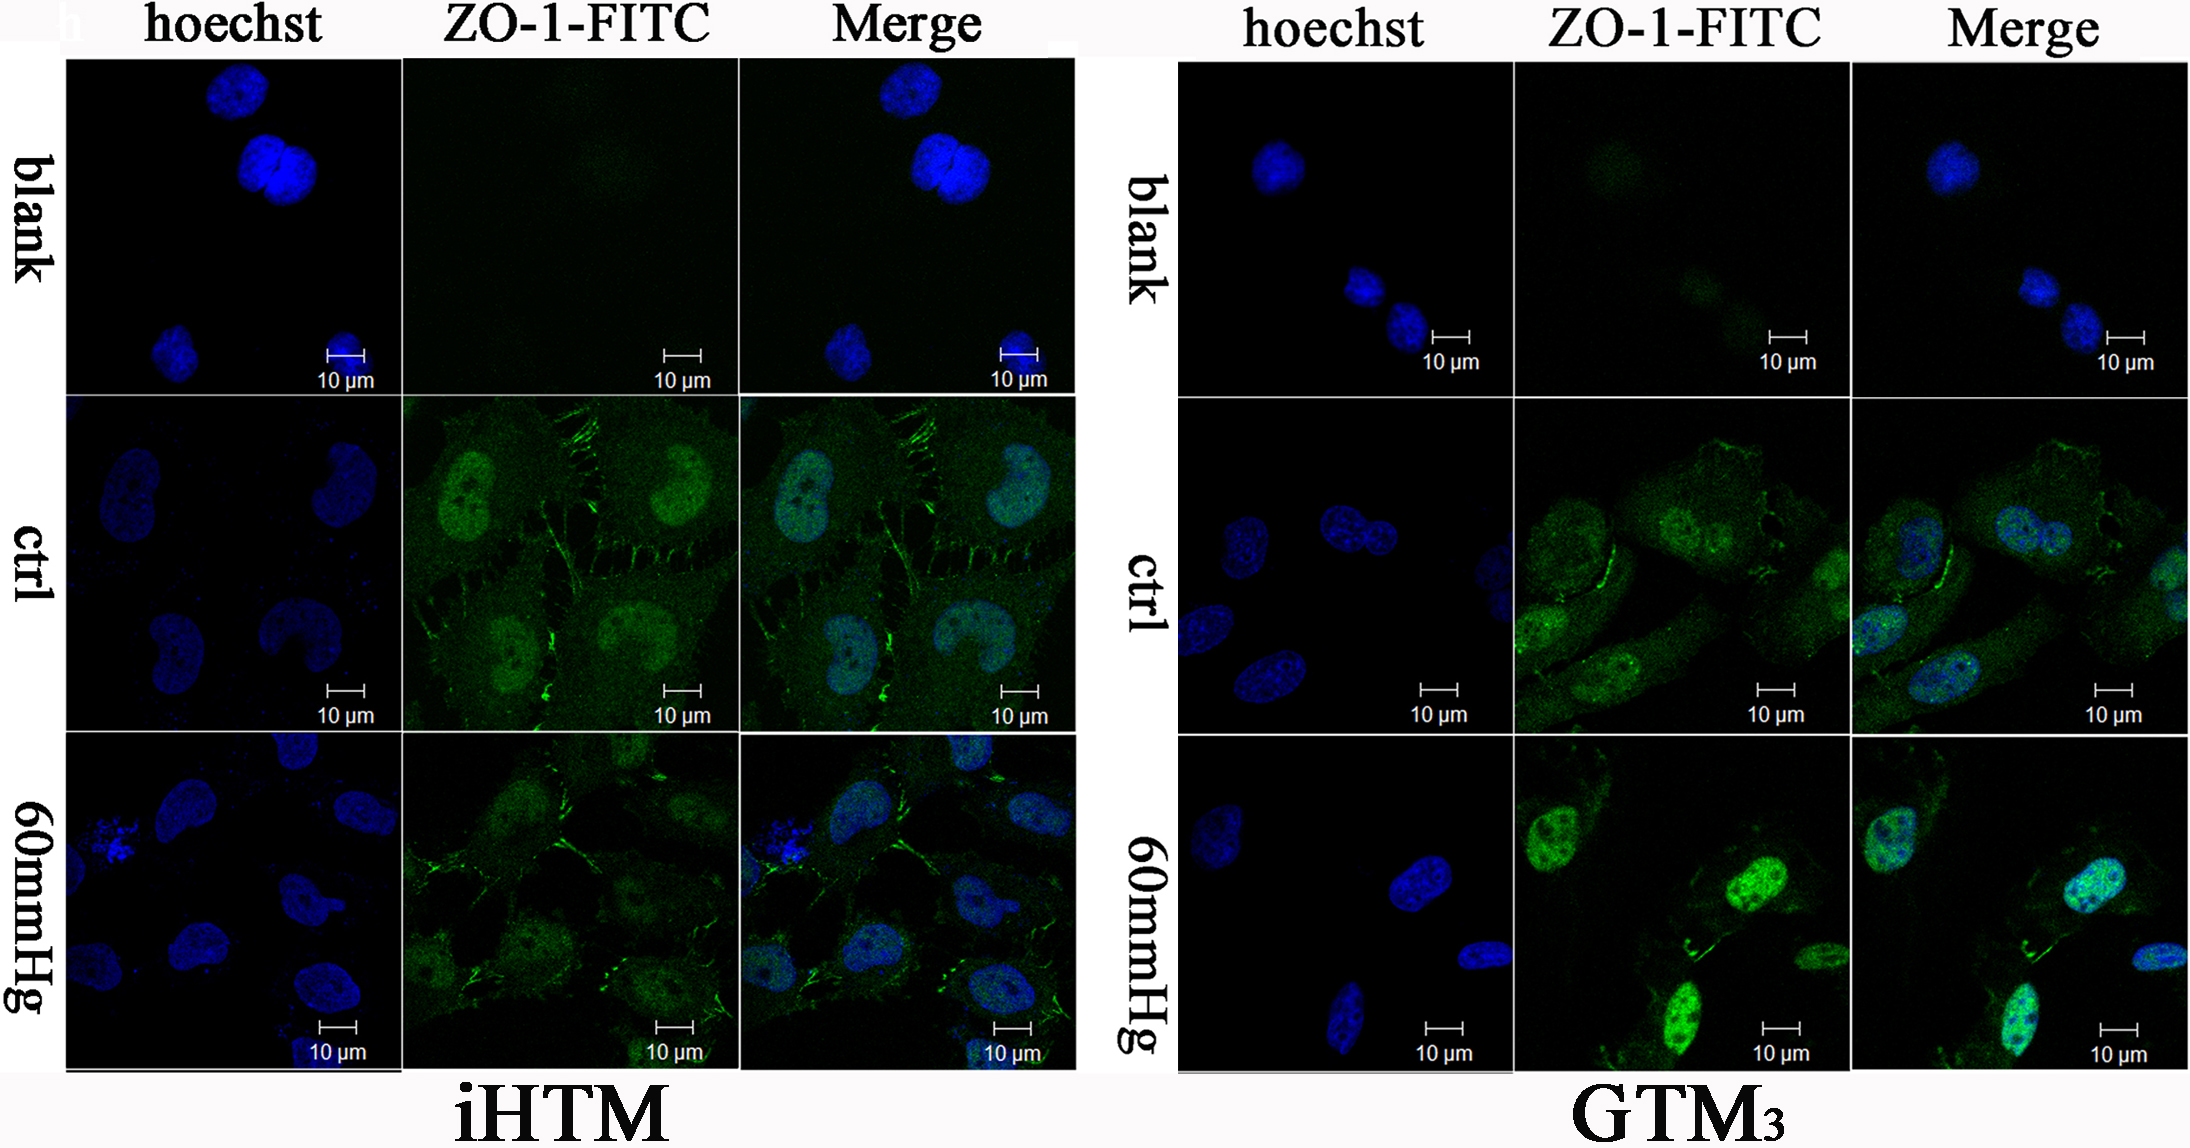
 Figure 3
of Yang, Mol Vis 2011; 17:2978-2985.
Figure 3
of Yang, Mol Vis 2011; 17:2978-2985.