Figure 1 of
Yang, Mol Vis 2011; 17:2978-2985.
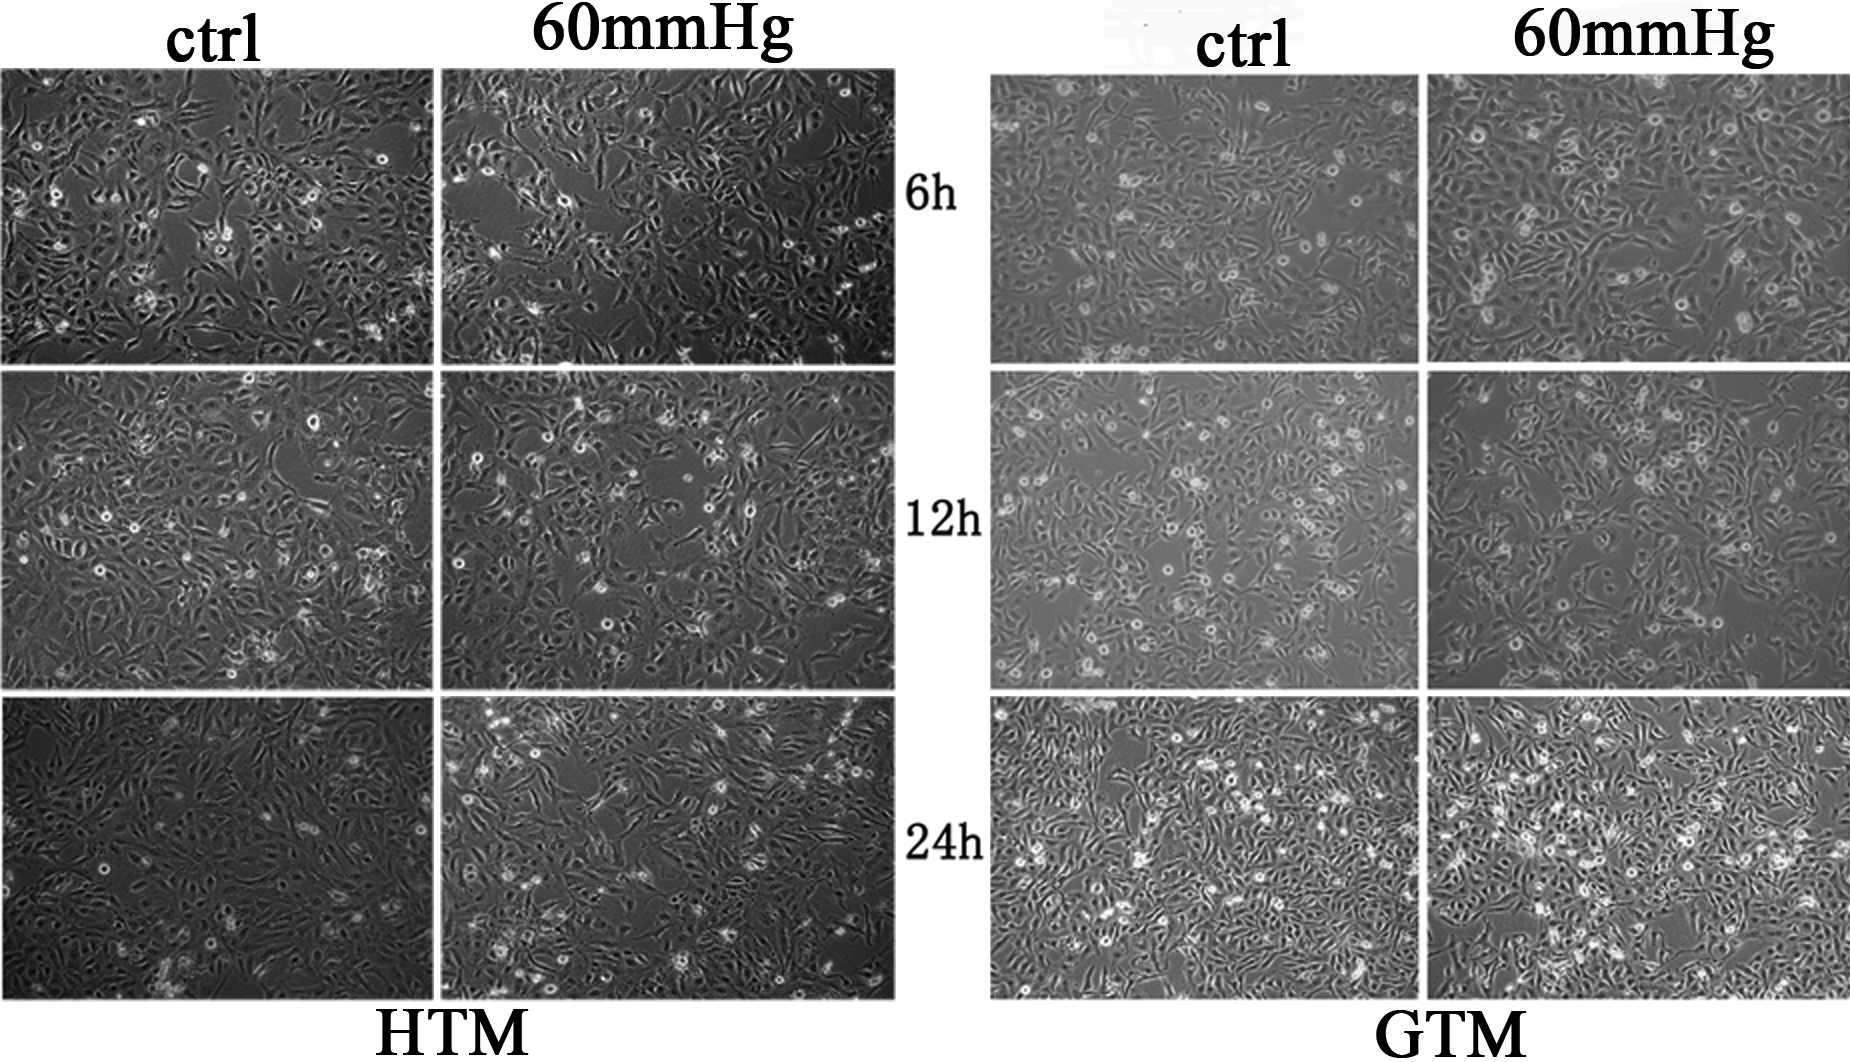
Figure 1.
The morphology comparison of control cells and cells in 60 mmHg hydrostatic pressure. After treatment for 6 to 24 h, there was no significant morphology changes of iHTM and GTM
3
.
 Figure 1
of Yang, Mol Vis 2011; 17:2978-2985.
Figure 1
of Yang, Mol Vis 2011; 17:2978-2985.