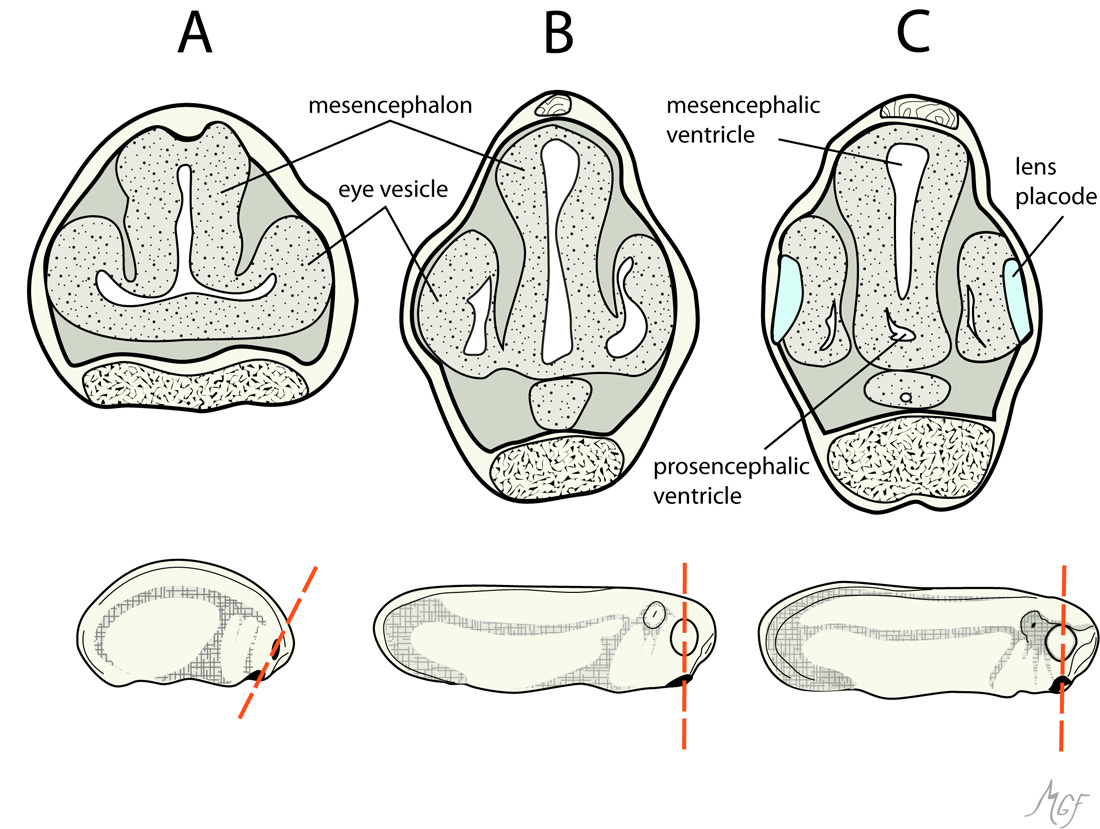
Figure 1. The relationship between the optic vesicle and brain ventricles in the developing
Xenopus embryo are shown in these diagrams. The cross-sections, which are through the optic vesicles (dashed lines), compare stages
23, 26, and 27 in
A, B, and
C respectively. These drawings, were prepared based on [
24,
30], to illustrate that the brain ventricle and optic vesicle lumens are continuous at least at stage 23.
 Figure 1 of
Gonzalez-Fernandez, Mol Vis 2011; 17:2956-2969.
Figure 1 of
Gonzalez-Fernandez, Mol Vis 2011; 17:2956-2969.