Figure 4. Ablation of cell division
cycle 42 homolog (S.cerevisiae; CDC42) does not affect retinal
morphology and function. A: The retinal morphology of Cdc42
conditional knockdown (cKD) and control mice was examined. Shown
are representative sections of 3 independent animals per
genotype. B: Gene expression levels of rod (rhodopsin, Rho;
rod transducin, Gnat1) and cone markers (middle
wavelength cone opsin, Opn1mw; short wavelength cone
opsin, Opn1sw) were analyzed in 12-week-old Cdc42
knockdown (black box) and control mice (white box). Shown are
mean values±SD, of 3 independent mice. Expression in control
mice was set to ‘1’. C: Retinal sections of Cdc42
knockdown and control mice were stained for RHO (top panels,
green), GNAT1 (middle panels, red), and OPN1sw (bottom panels,
red). Blue: nuclei (4’,6 diamidino-2-phenylindole [DAPI]
staining). Shown are representative sections from 3 mice. D:
Representative scotopic (dark-adapted) and photopic
(light-adapted) single flash electroretinogram (ERG) recordings
with increasing light intensities show retinal function of Cdc42
knockdown (red line) and control (black line) mice at 12 weeks
of age. The vertical line shows the timing of the light flash
and flash intensities are indicated in [log (cd*s/m2)].
E: B-wave amplitudes of scotopic (SC) and photopic (PH)
single flash ERG recordings in Cdc42 knockdown (red
line, n=3) and control (black line, n=4) mice are blotted as a
function of the logarithm of flash intensity. Boxes indicate the
25% and 75% quantile range, whiskers the 5% and 95% quantiles
and solid lines connect the medians of the data. Scale bars: 50
mm. OS: photoreceptor outer segments. IS: photoreceptor inner
segments. ONL: outer nuclear layer. INL: inner nuclear layer.
GCL: ganglion cell layer.
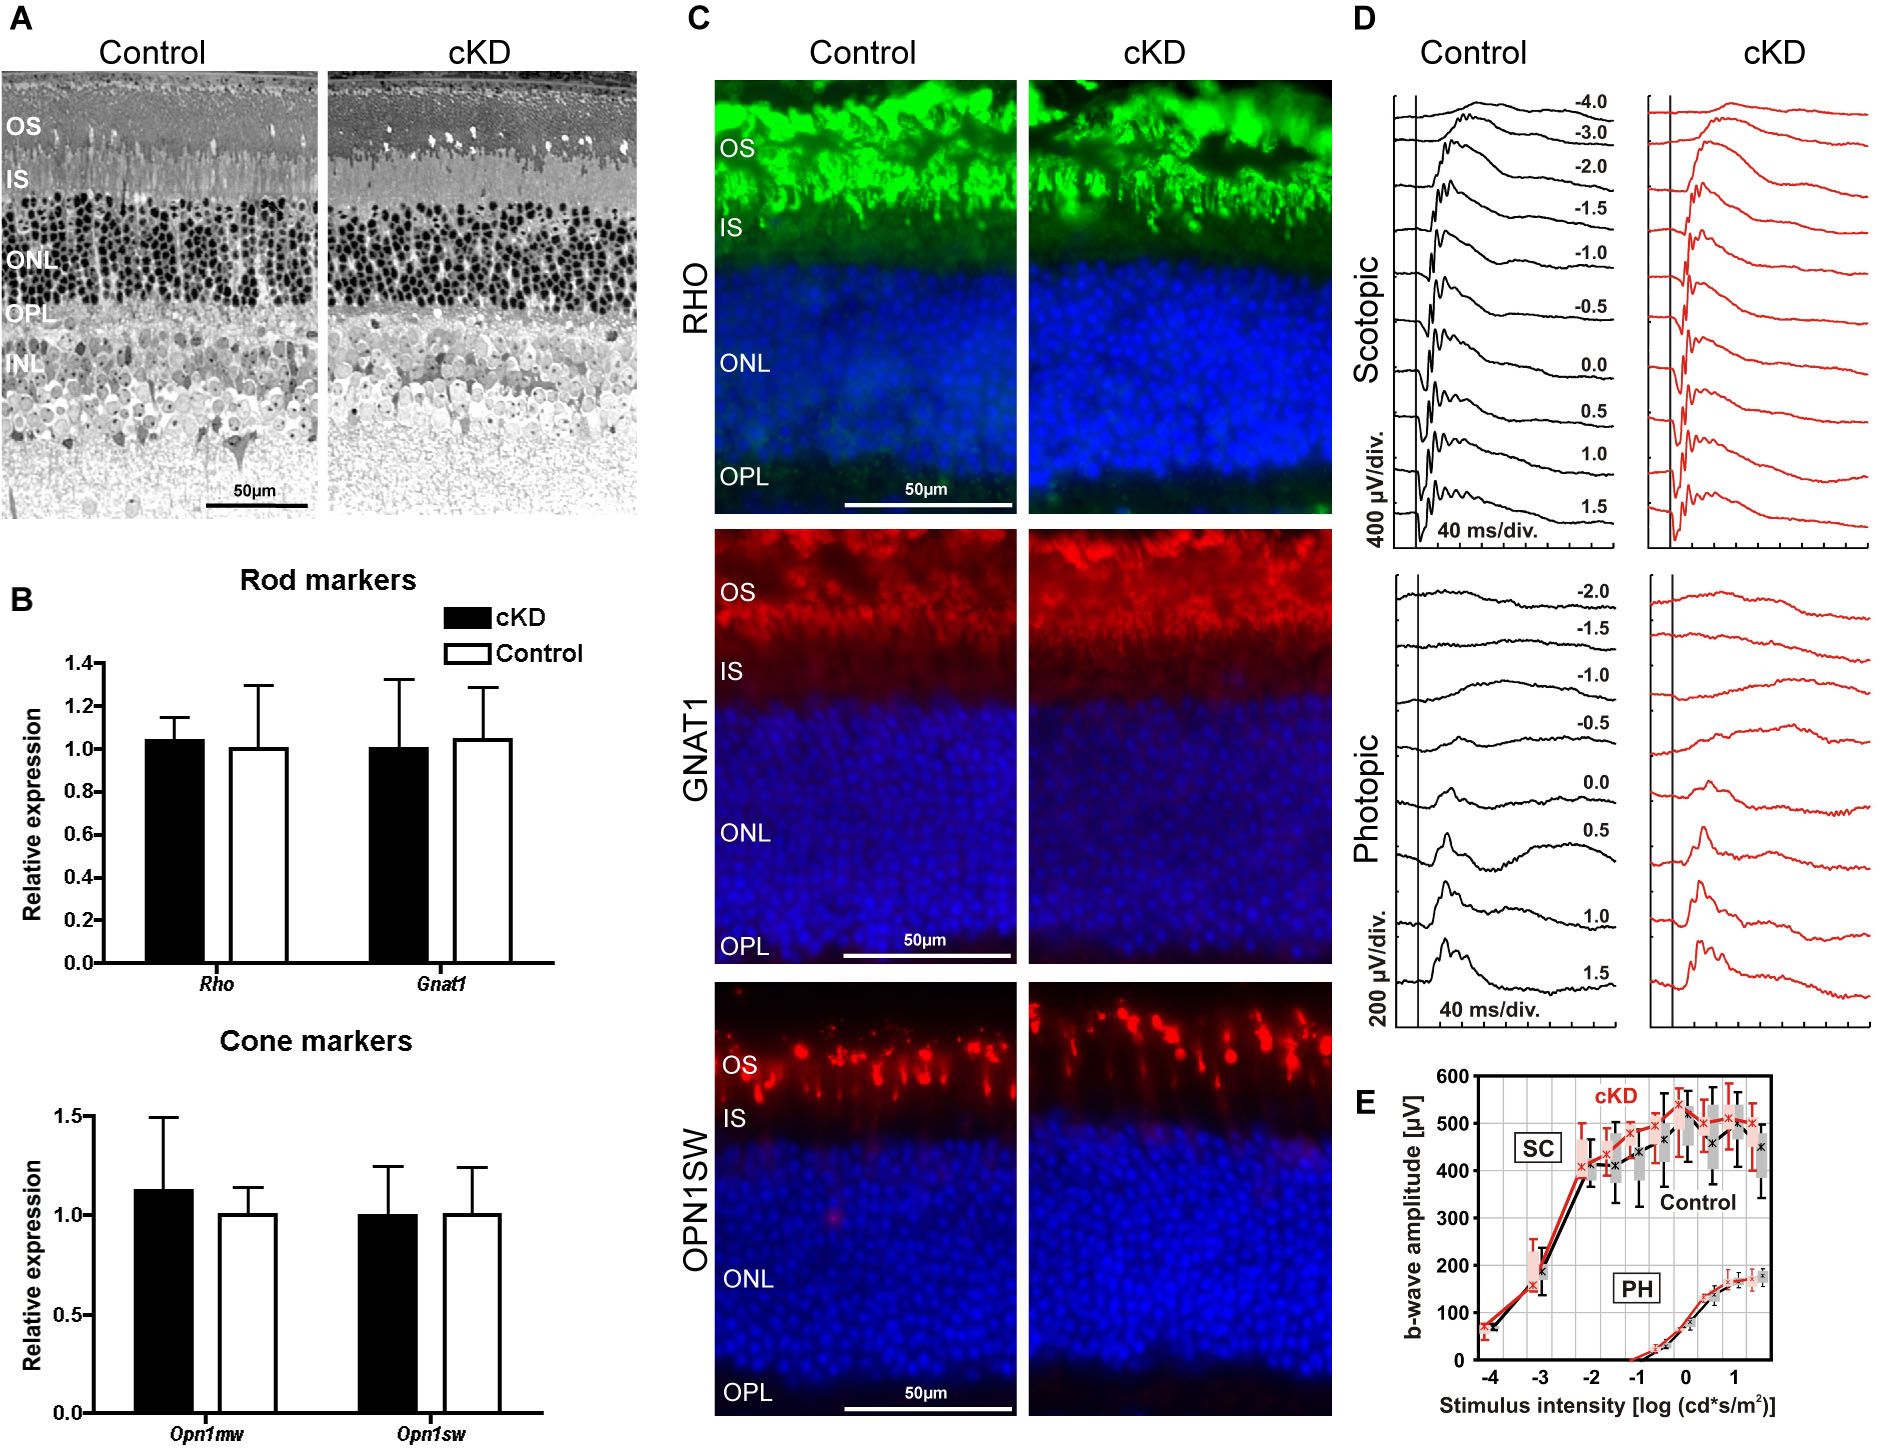
 Figure 4
of Heynen, Mol Vis 2011; 17:2934-2946.
Figure 4
of Heynen, Mol Vis 2011; 17:2934-2946.