Figure 4. Electron micrographs of the astrocytes (A, C) and oligodendrocytes (B, D) of bilateral optic nerves. A and B, control; C and D, treated. Astrocytes (as); oligodendrocyte (oligo); swelling mitochondria (arrows); rough endoplasmic reticulum vacuoles
(double arrows), and condensed chromatin (arrowheads). Scale bars: C and D;10,000×; A and B; 8,000×.
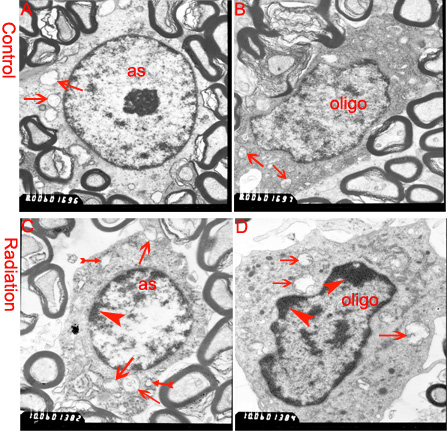
 Figure 4 of
Xia, Mol Vis 2011; 17:2920-2933.
Figure 4 of
Xia, Mol Vis 2011; 17:2920-2933.