Figure 3. Double immunofluorescence staining for Olig2 (red) and DAPI (blue) on paraffin sections of the control and treated optic nerves
using fluorescence microscopy. Overlay images demonstrate Olig2 and DAPI double positive cells. The cells positive for Olig2
(and not DAPI) are blood cells, and the cells positive for DAPI (and not Olig2) are inflammatory or microglial cells. The
single arrows indicate oligodendrocyte cells, and the double arrows indicate inflammatory cells. The number of Olig2-positive
cells and inflammatory cells apparently increased in the treated optic nerves. The images are representative of results obtained
from three separate experiments. A–D control; E–I treated. Scale bars: A, B, C, E, F, and H; 100×; D and I; 400×.
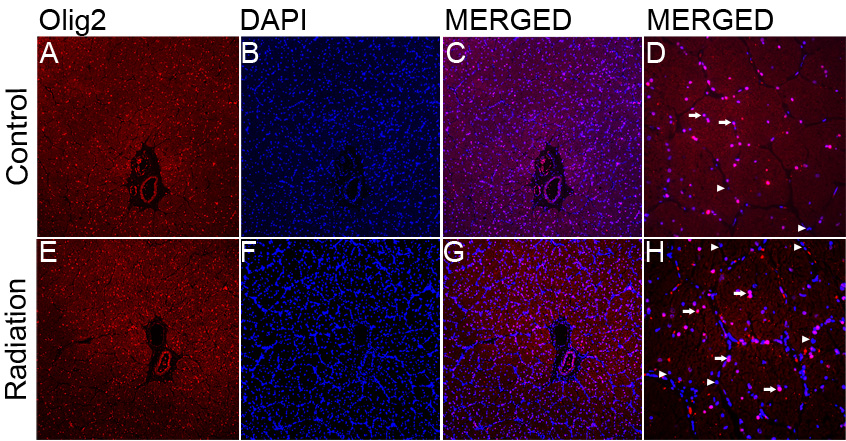
 Figure 3 of
Xia, Mol Vis 2011; 17:2920-2933.
Figure 3 of
Xia, Mol Vis 2011; 17:2920-2933.