Figure 2. The comparative changes of glial fibrillary acidic protein (GFAP) immunohistochemical staining between control and treated
optic nerve. The single arrows indicate astrocytes and the double arrows indicate inflammatory cells. A, B: The control, illustrating the typical bushy appearance of astrocytes with fine cellular processes. C, D: The astrocytic processes in the treated nerves displayed were shorter than those in the controls, were not straight, and
were accompanied by decreased GFAP immunostaining. The images are representative of results obtained from three separate experiments.
Scale bars: A and C, 200×; B and D; 400×.
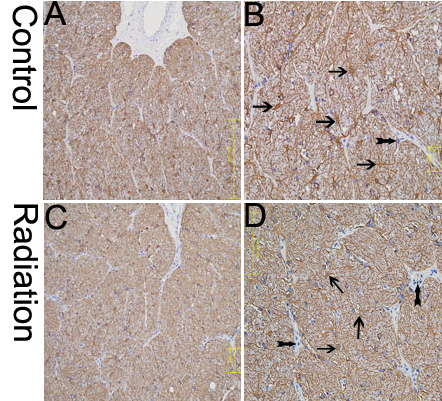
 Figure 2 of
Xia, Mol Vis 2011; 17:2920-2933.
Figure 2 of
Xia, Mol Vis 2011; 17:2920-2933.