Figure 1. Coupled two-way clustering of samples and differentially expressed genes. A clustering analysis was performed to show the
pattern of similarities among three separate groups after radiation treatment, using the differentially expressed genes. Rows
represent genes, and columns represent samples. Red and green blocks, respectively, represent high and low expression relative
to the control sample, and black blocks indicate equal expression, for which the standard deviation from the mean value is
shown at the right. The cluster image shows the treated sides (monkey 01left retina, monkey 02left retina, monkey 03right
retina) and the control sides (monkey 01right retina, monkey 02right retina, monkey 03left retina).
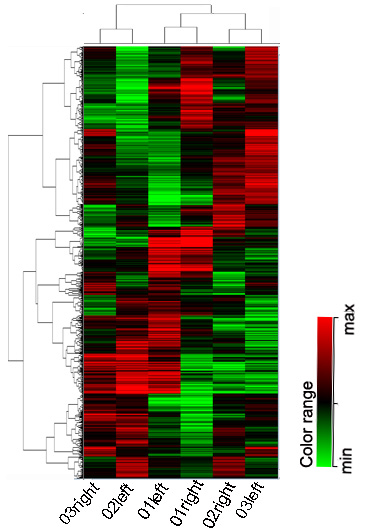
 Figure 1 of
Xia, Mol Vis 2011; 17:2920-2933.
Figure 1 of
Xia, Mol Vis 2011; 17:2920-2933.