Figure 9. Cell proliferation (MTT) assay of LECs. LECs cultivated on electrospun nanofiber scaffold and HAM at different time intervals
(days 0, 7, 10, and 14) and their proliferation potential compared with glass coverslips (control). Data represents three
independent experiment and all data points plotted as mean values±SD (*p<0.001, **p<0.05).
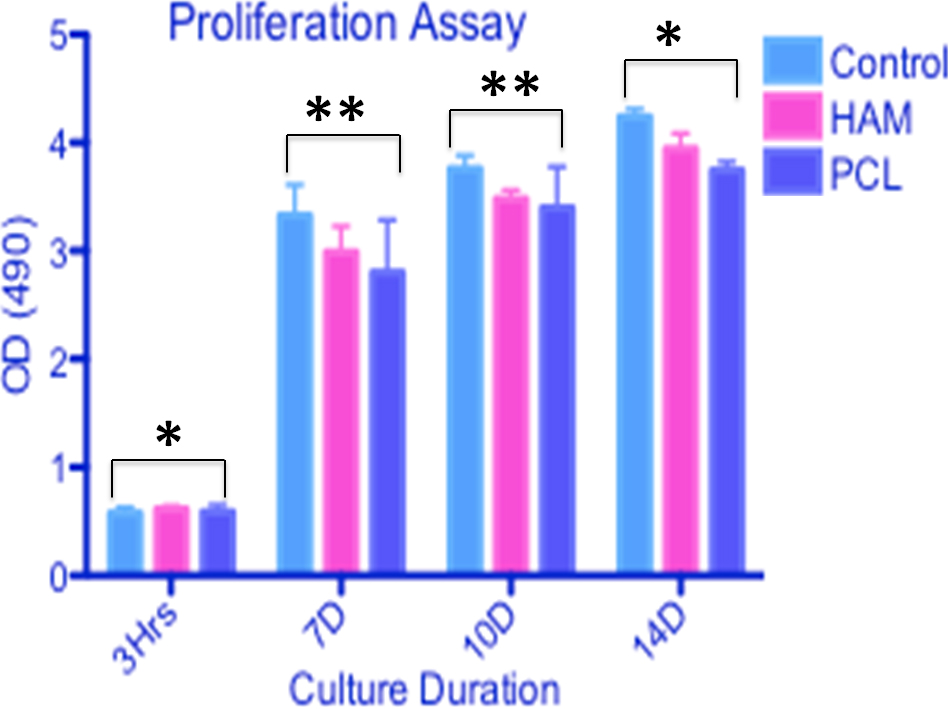
 Figure 9 of
Sharma, Mol Vis 2011; 17:2898-2910.
Figure 9 of
Sharma, Mol Vis 2011; 17:2898-2910.