Figure 11. RT PCR analysis of LECs expanded over PCL nanofibers, HAM and control surface (coverslip): Differentiation markers (A) K3 (145 bp), (B) K12 (150 bp) and stem cell–associated (C) K19 (331 bp), (D) ABCG2 (379 bp), (E) GAPDH (219 bp) used as an internal control.
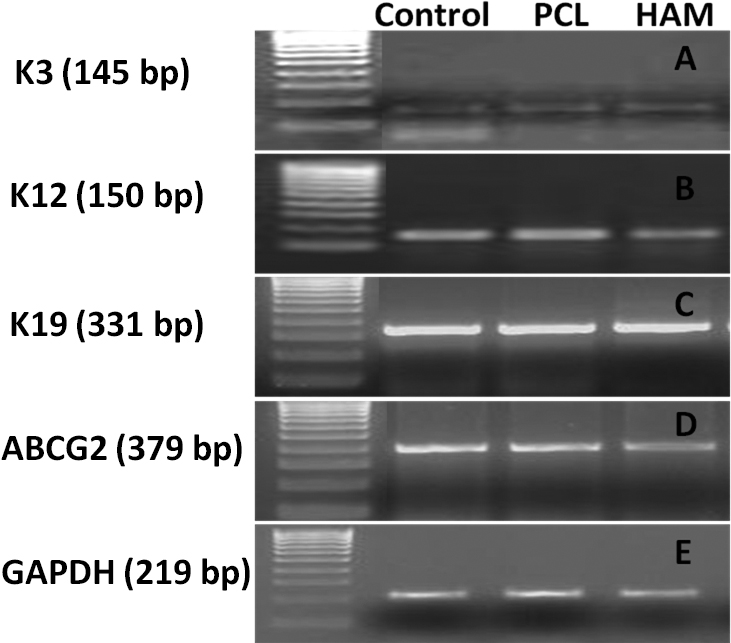
 Figure 11 of
Sharma, Mol Vis 2011; 17:2898-2910.
Figure 11 of
Sharma, Mol Vis 2011; 17:2898-2910.