Figure 4. CAV-1 expression and secretion from NTM and GTM cells. A: DEX differentially induces CAV-1 expression in NTM-5 and GTM-3 cells after 24 and 48 h. Western blot probed with CAV-1 Ab.
Below – the same blot was reprobed for actin. B: The first four lanes (1–4) for NTM samples shown in A were scanned using KODAK MI Software. C: The next four lanes (5–8) for GTM samples were scanned. The values indicated represent the means±SEM from four independent
experiments. D and E: CAV-1 in cell extracts (CE; lanes 1–3 and 7–9) and conditioned media (CM; lanes 4–6 and 10–12) of NTM-5 and GTM-3 cells.
Lanes 1 and 7 – control cells; lanes 2 and 8 – cells were incubated with 100 μM of DEX for 96 h; lanes 3 and 9 – cells incubated
with 5 ng/ml of TGFβ2 for 48 h. TGFβ2 reduced CAV-1 expression to 85% in NTM-5 cells (lane 3) and to 68% in GTM-3 cells (lane
9), whereas DEX did not affect CAV-1 expression after 96 h. Low level of CAV-1 secretion was observed from NTM cells (D, lanes 4–6) which was increased by DEX (lane 5). No expression was observed from GTM cells (E, lanes10–12). F: Bands for NTM samples shown in D were scanned. G: Bands for GTM samples shown in E were scanned. The values indicated represent the means±SEM from four independent experiments.
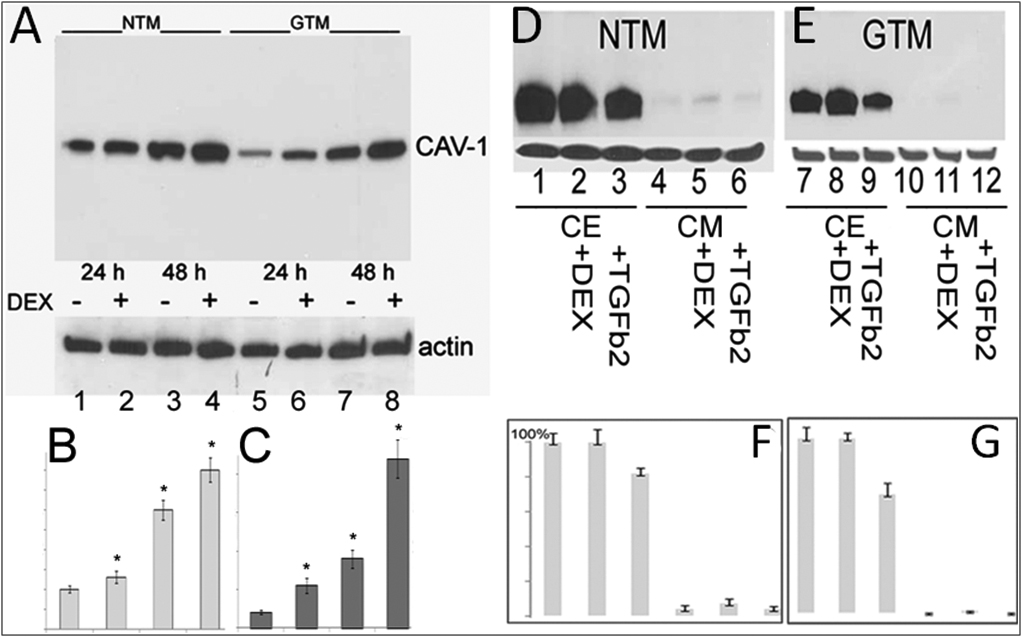
 Figure 4 of
Surgucheva, Mol Vis 2011; 17:2878-2888.
Figure 4 of
Surgucheva, Mol Vis 2011; 17:2878-2888.