Figure 2. CAV-1 and CAV-2 in TM of POAG patients and controls. Total protein (20 μg) from TM cells were resolved in 12% SDS-polyacrylamide
gels, transferred on PVDF membrane and probed with Abs to CAV-1 (A) and CAV-2 (B). The amount of CAV-1 was similar both in POAG patients and controls, whereas the CAV-2 was highly variable among samples.
Heterooligomers CAV-1 – CAV-2 are shown by arrowheads.
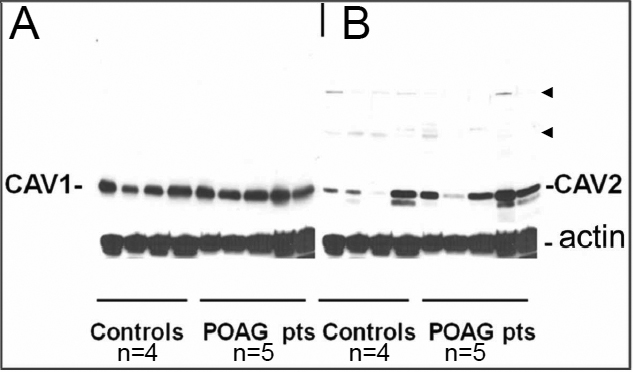
 Figure 2 of
Surgucheva, Mol Vis 2011; 17:2878-2888.
Figure 2 of
Surgucheva, Mol Vis 2011; 17:2878-2888.