Figure 9. Non-random distribution
pattern in the time-dependent acquisition of nuclear propidium
iodide (PI) fluorescence in ARPE-19 cells exposed to toxic doses
of H2O2. Live cell imaging of dynamic
changes in nuclear PI fluorescence in ARPE-19 cells following
pulse delivery of H2O2. Images are
bright-field-fluorescence overlays from two separate experiments
illustrating nuclear PI staining (red) in cells at selected time
intervals after exposure to row A: 750 μM or row B:
1000 μM H2O2. Images were captured at 5
min intervals after oxidant addition; the acquisition times of
the selected images are indicated. The circled area identifies a
region where earlier onset nuclear PI fluorescence has begun to
fade 5 h later. Scale bar: 40 μm.
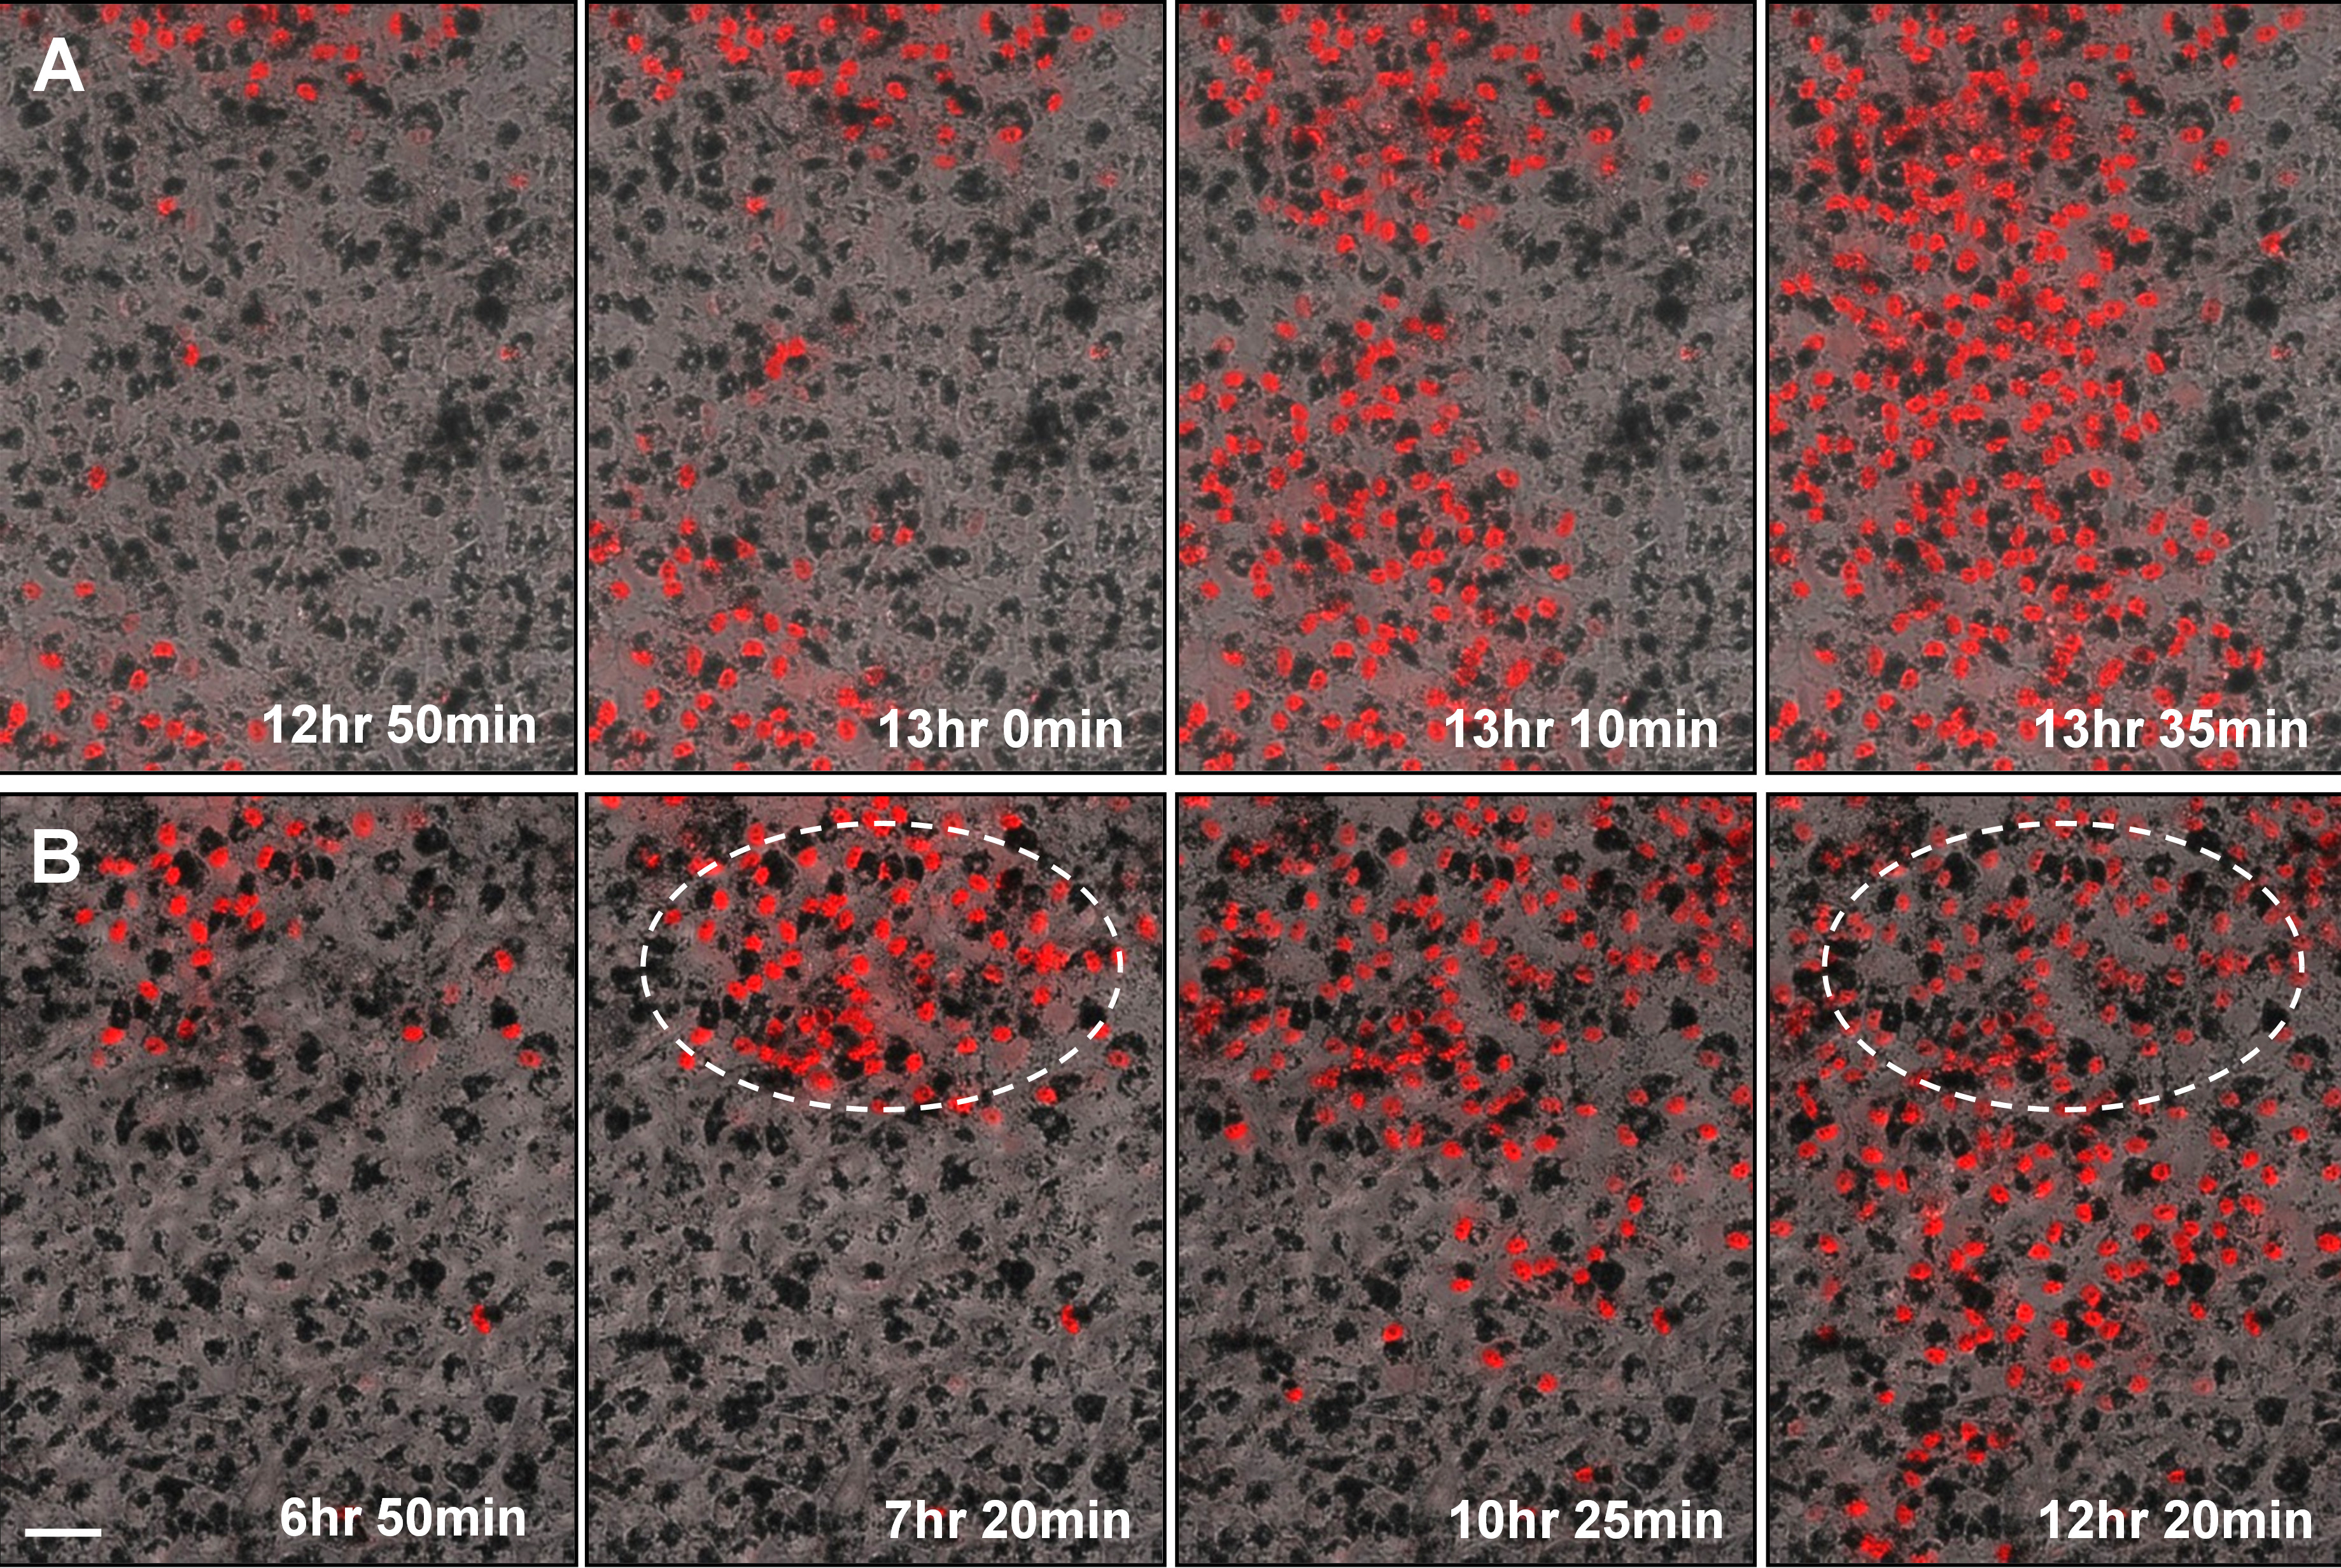
 Figure 9
of Burke, Mol Vis 2011; 17:2864-2877.
Figure 9
of Burke, Mol Vis 2011; 17:2864-2877.