Figure 8. Direct comparison of the
effects of photobleached and untreated melanosomes on the
sensitivity of individual ARPE-19 cells to H2O2-induced
toxicity in co-cultures. A: Merged bright-field and
fluorescence images illustrating cells in co-cultures containing
either untreated granules (identified by co-phagocytosis of
marker fluorescent beads detected by 542 excitation/612 emission
[shown red, two upper cells]), or containing photobleached
granules (identified by marker beads with 468 excitation/508
emission [shown green, lower cell]). Scale bar: 10 μm. B:
Live cell imaging of dynamic changes in nuclear PI fluorescence
for co-cultured cells pre-loaded with untreated (mel) or
photobleached melanosomes (pb mel) and treated with 800 μM H2O2.
Numbers of cells containing the different particle types
pre-selected for analysis were as follows: mel, n=38 (black
circles); pb mel, n=32 (open circles). Data are the percent of
the pre-selected cells in each particle group surviving (no
nuclear PI) with time. The shift to the left of the curve for pb
mel illustrates the magnitude of the decreased survival for
cells containing pb mel relative to mel. The curves differ
significantly (GraphPad Prism 5 survival analysis, p<0.02).
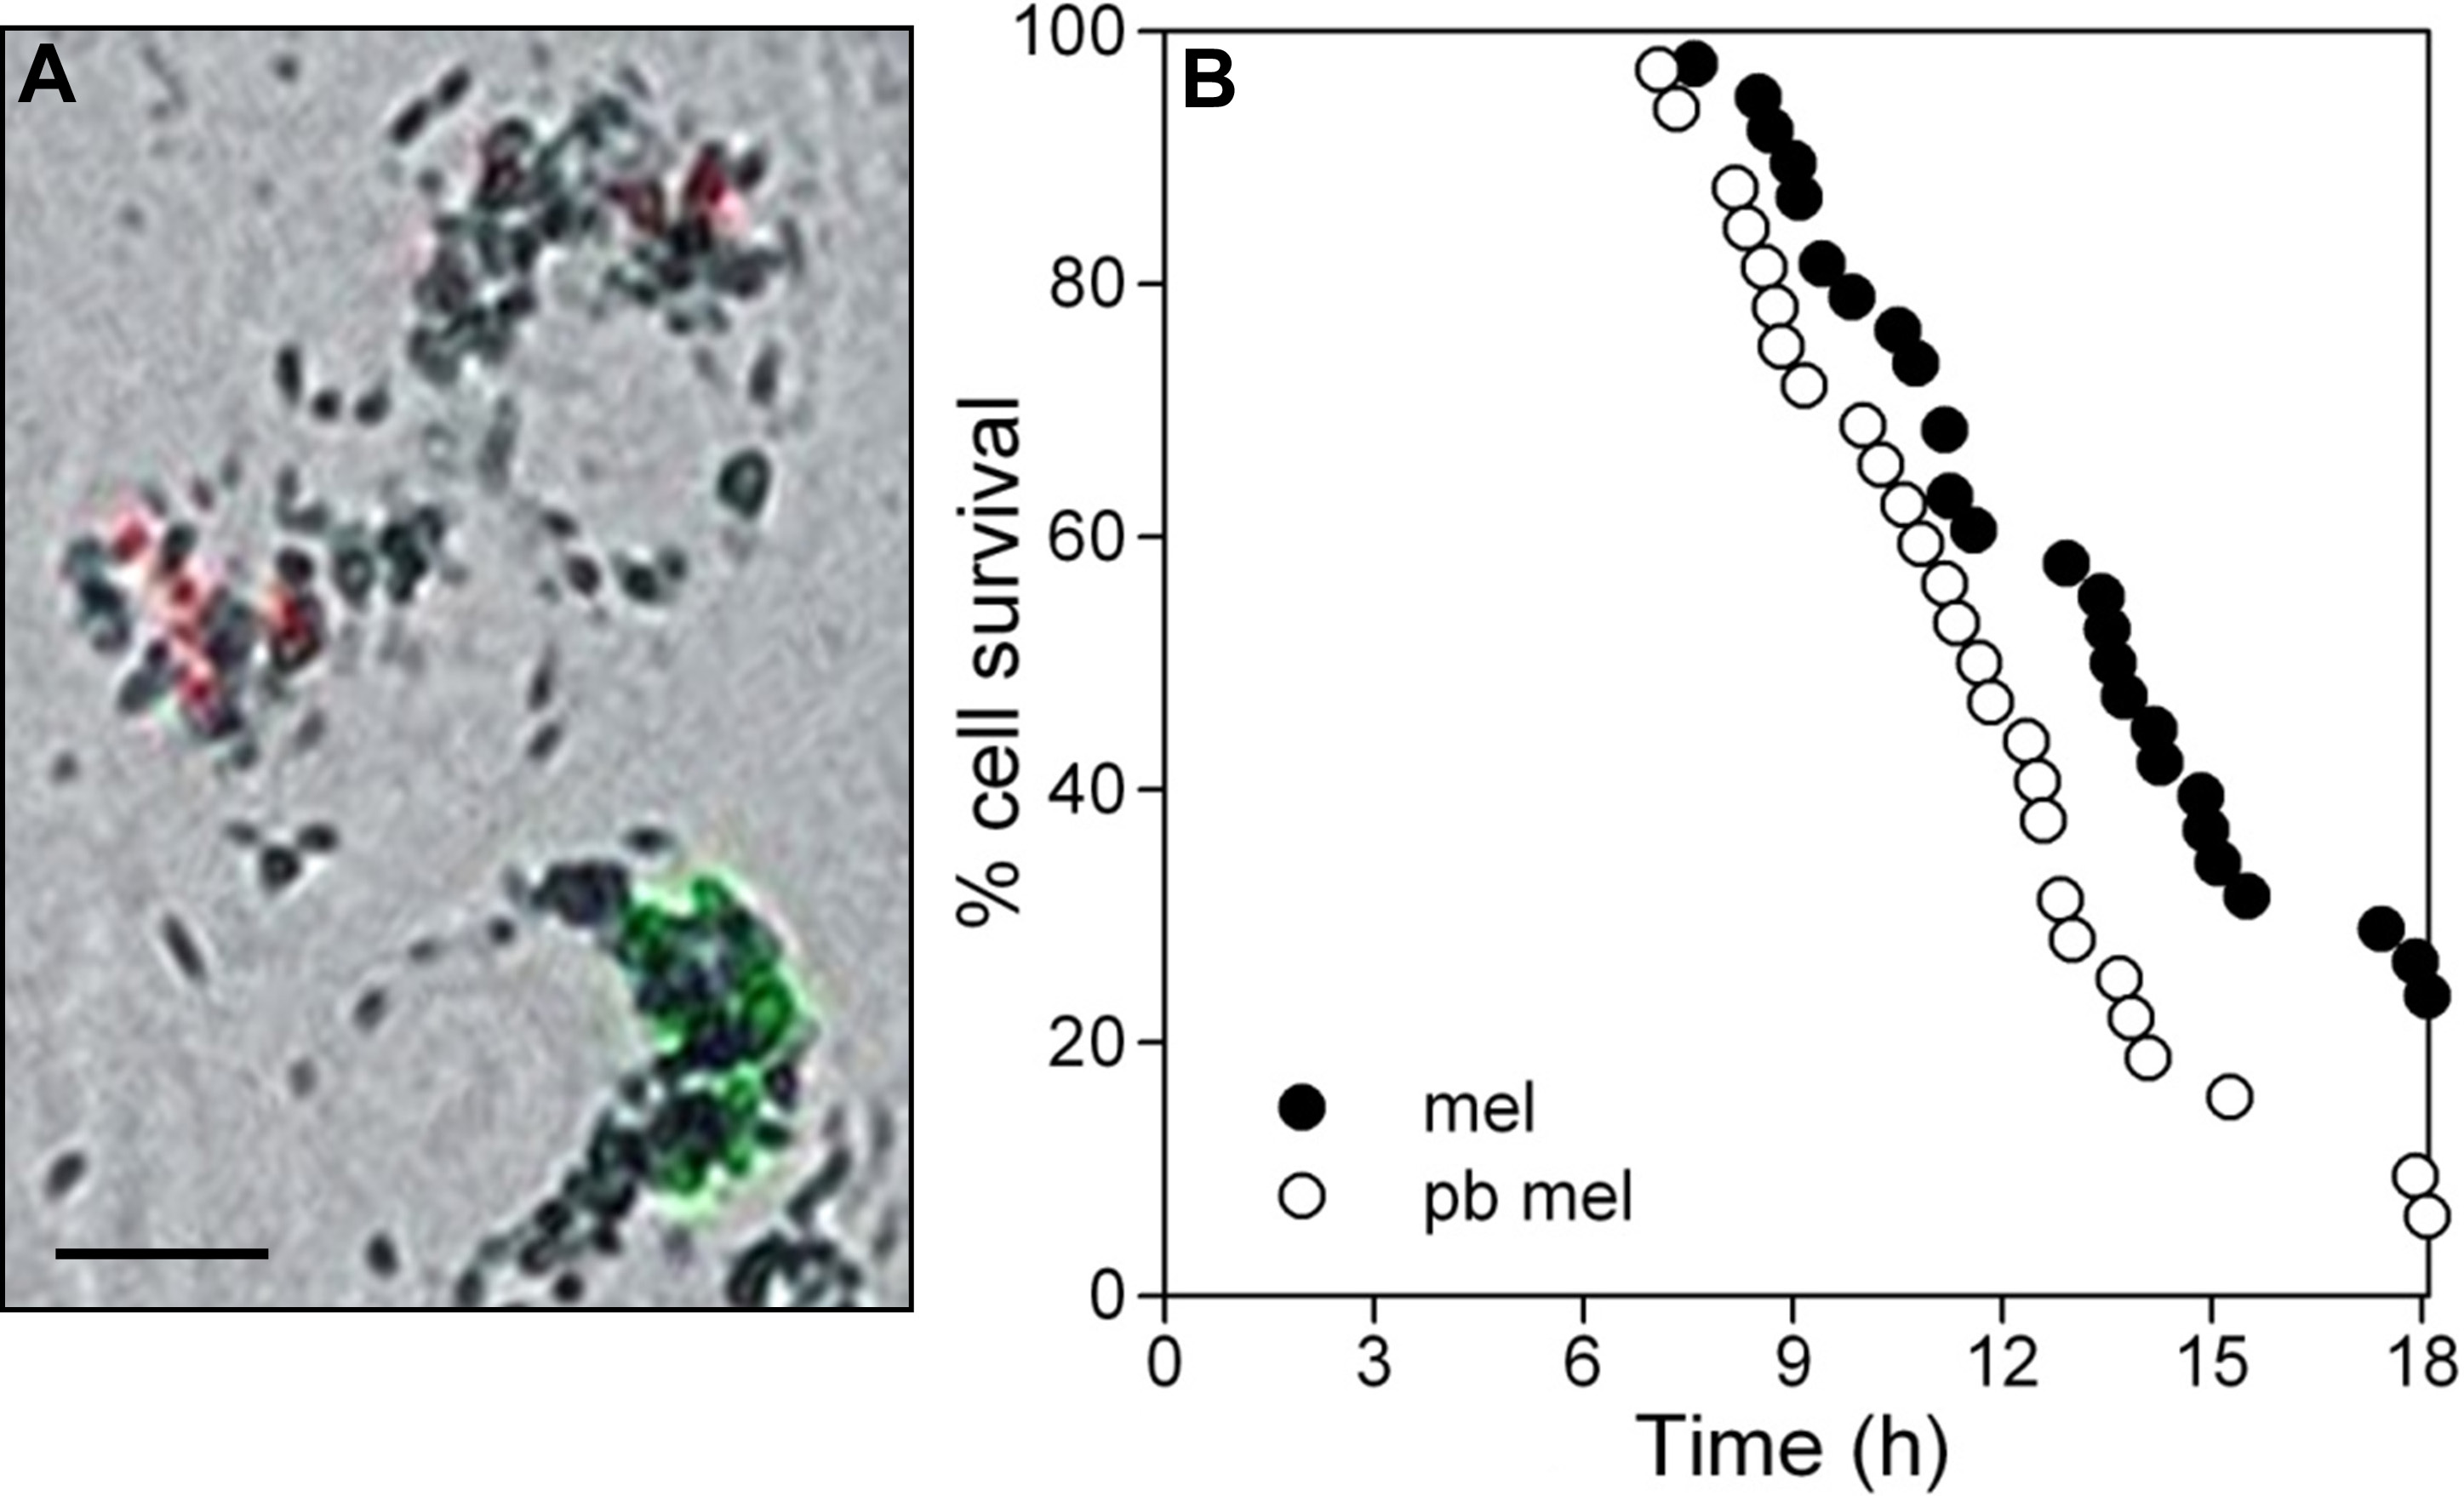
 Figure 8
of Burke, Mol Vis 2011; 17:2864-2877.
Figure 8
of Burke, Mol Vis 2011; 17:2864-2877.