Figure 5. Dose-dependent H2O2-induced
toxicity in individual ARPE-19 cells shown by time-dependent
image analysis of nuclear propidium iodide (PI) fluorescence.
Live cell imaging of dynamic changes in nuclear PI fluorescence
in ARPE-19 cells containing control particles (latex beads)
after treatment with three doses of H2O2
delivered either as A: a pulse or B: generated
enzymatically after the addition of glucose oxidase (GOx) The
concentrations of H2O2 (in μM) or GOx (in
mU/ml) are indicated. Numbers of cells selected for analysis
were as follows. A: 900 μM, n=166; 1000 μM, n=194; 1200
μM, n=163. B: 17 mU/ml, n=123; 22.5 mU/ml n=123; 30
mU/ml, n=165. Data are from representative experiments and are
the percent of cells pre-selected for bead content that survived
(no nuclear PI) with time. All curves within each treatment
protocol differ significantly from one another (GraphPad Prism 5
survival analysis, p<0.02). C:
Bright-field-fluorescence overlays of cultures treated with 22.5
mU/ml GOx to illustrate the time-dependent increase in numbers
of cells exhibiting nuclear PI fluorescence (shown white).
Images were captured at 5 min intervals; the acquisition times
of the selected images are indicated. Scale bar: 20 μm.
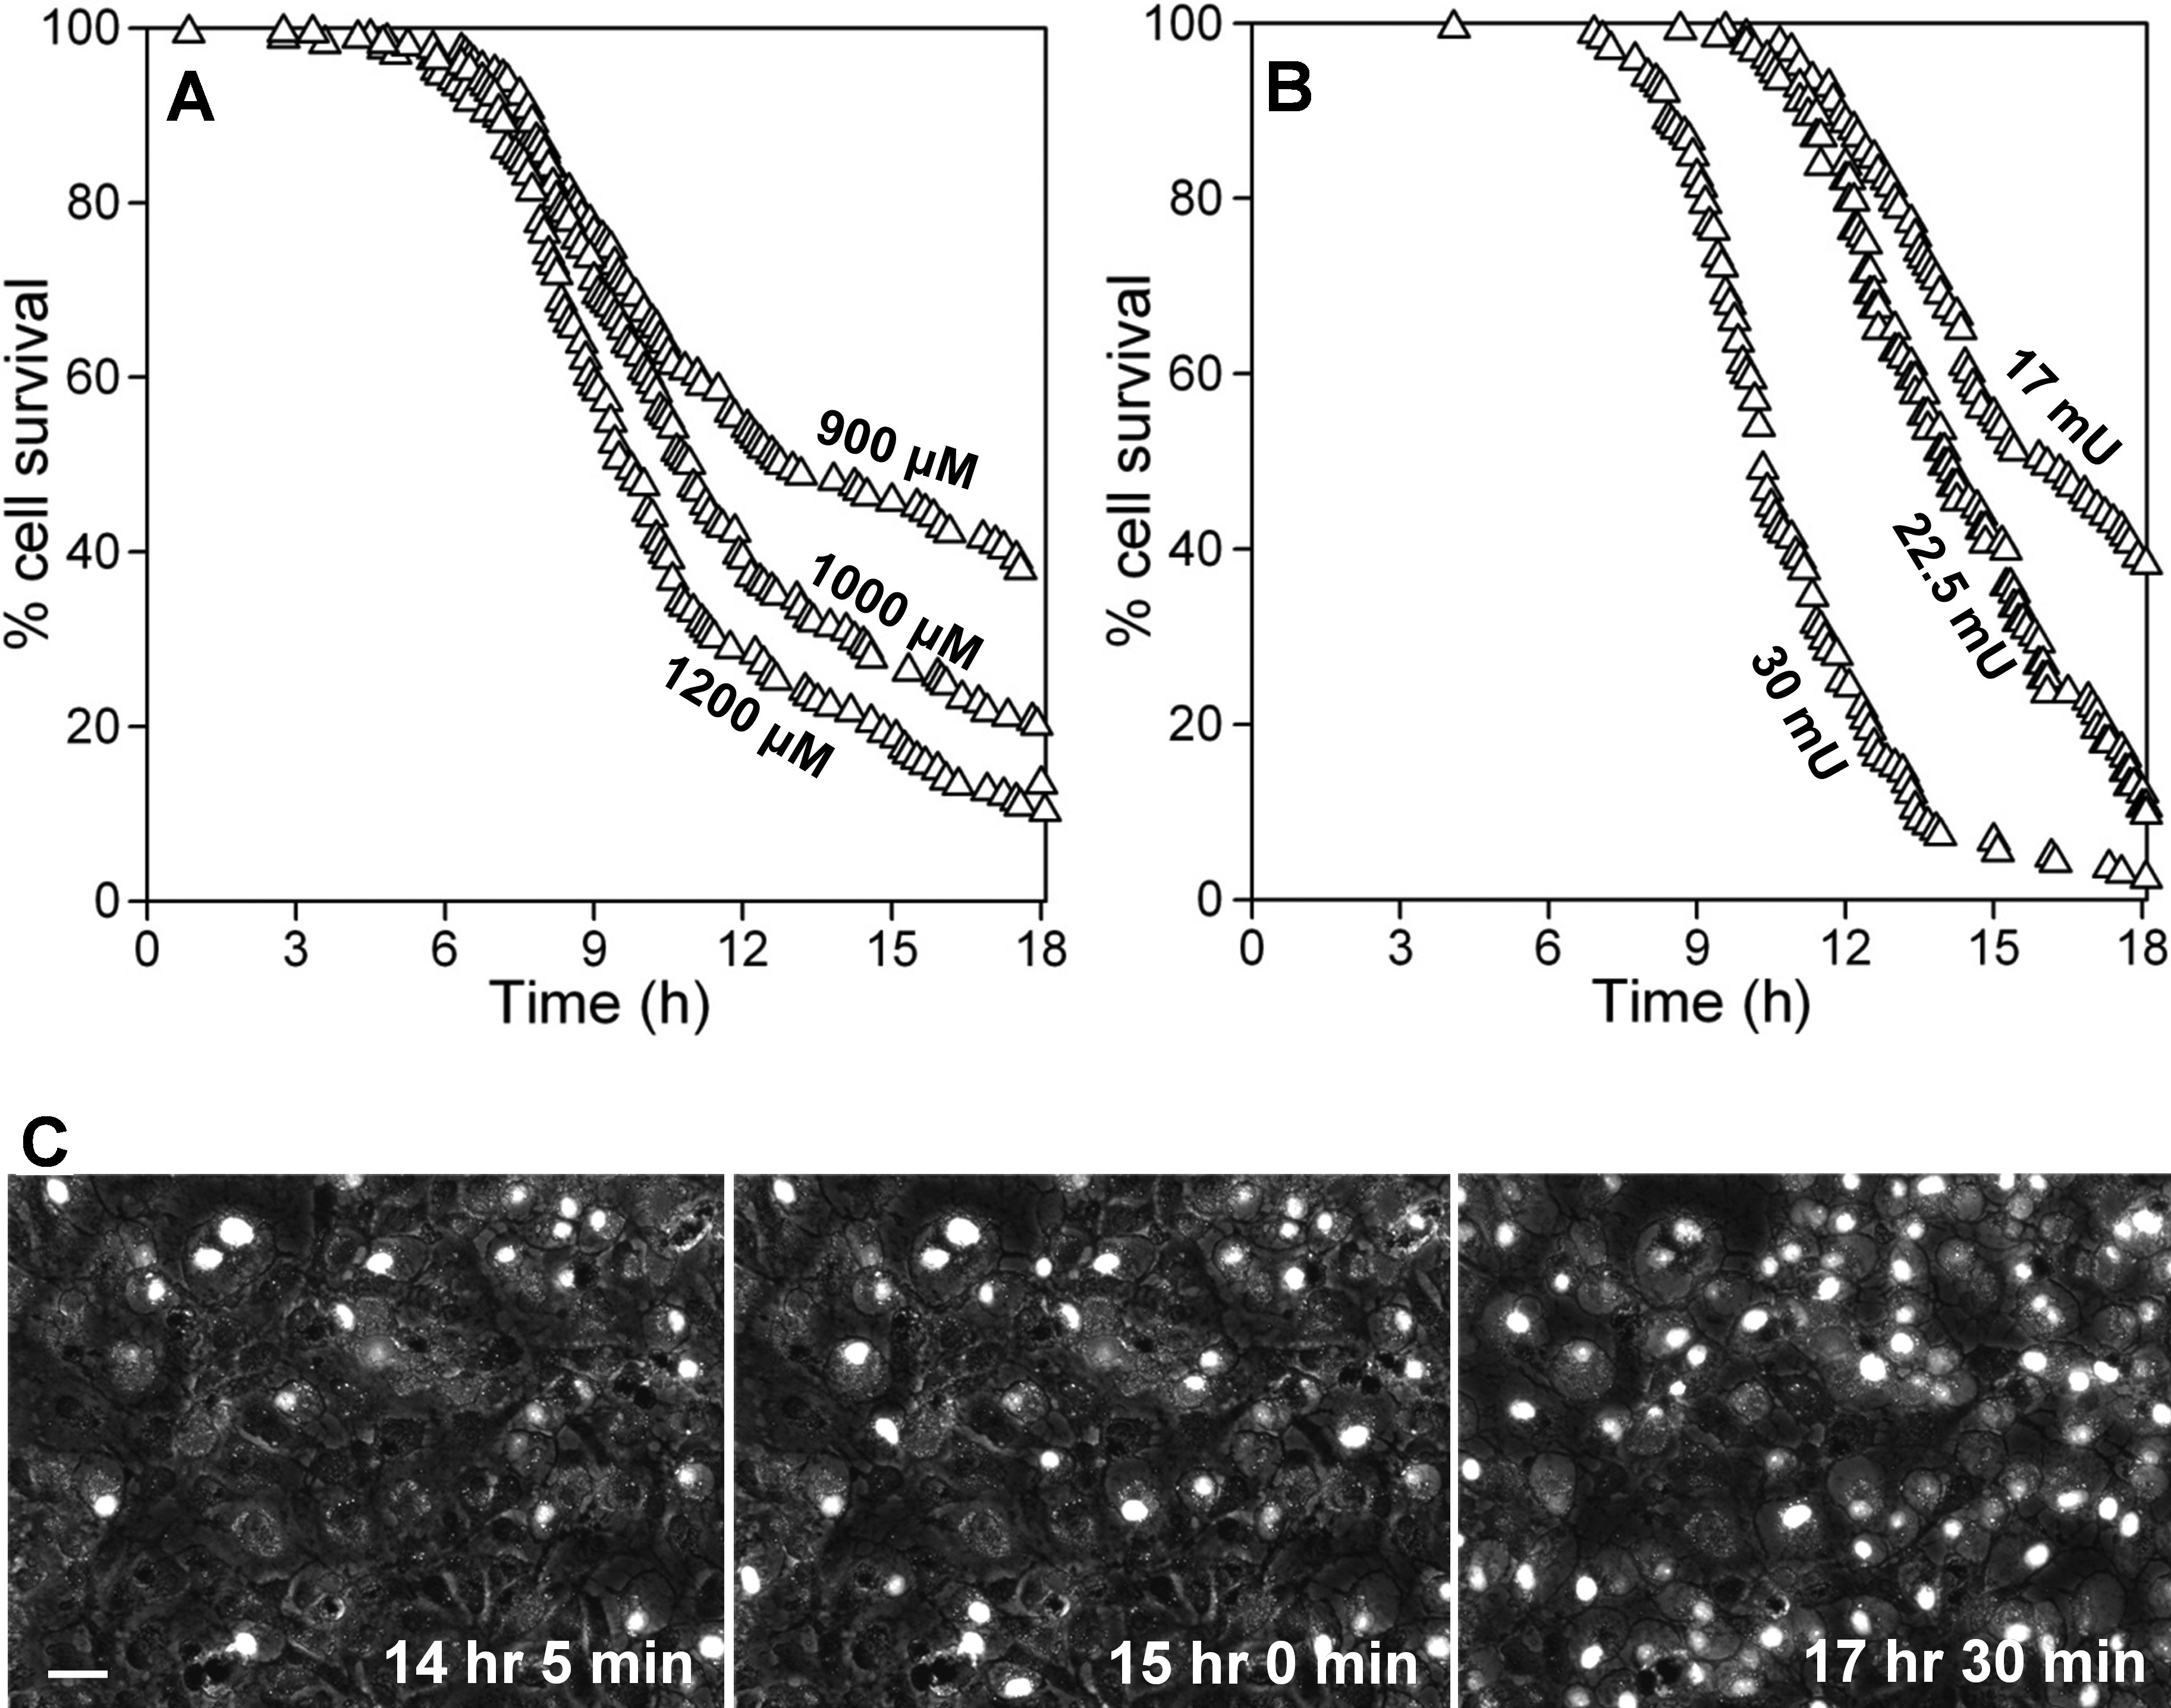
 Figure 5
of Burke, Mol Vis 2011; 17:2864-2877.
Figure 5
of Burke, Mol Vis 2011; 17:2864-2877.