Figure 3 of
Ecker, Mol Vis 2011; 17:2856-2863.
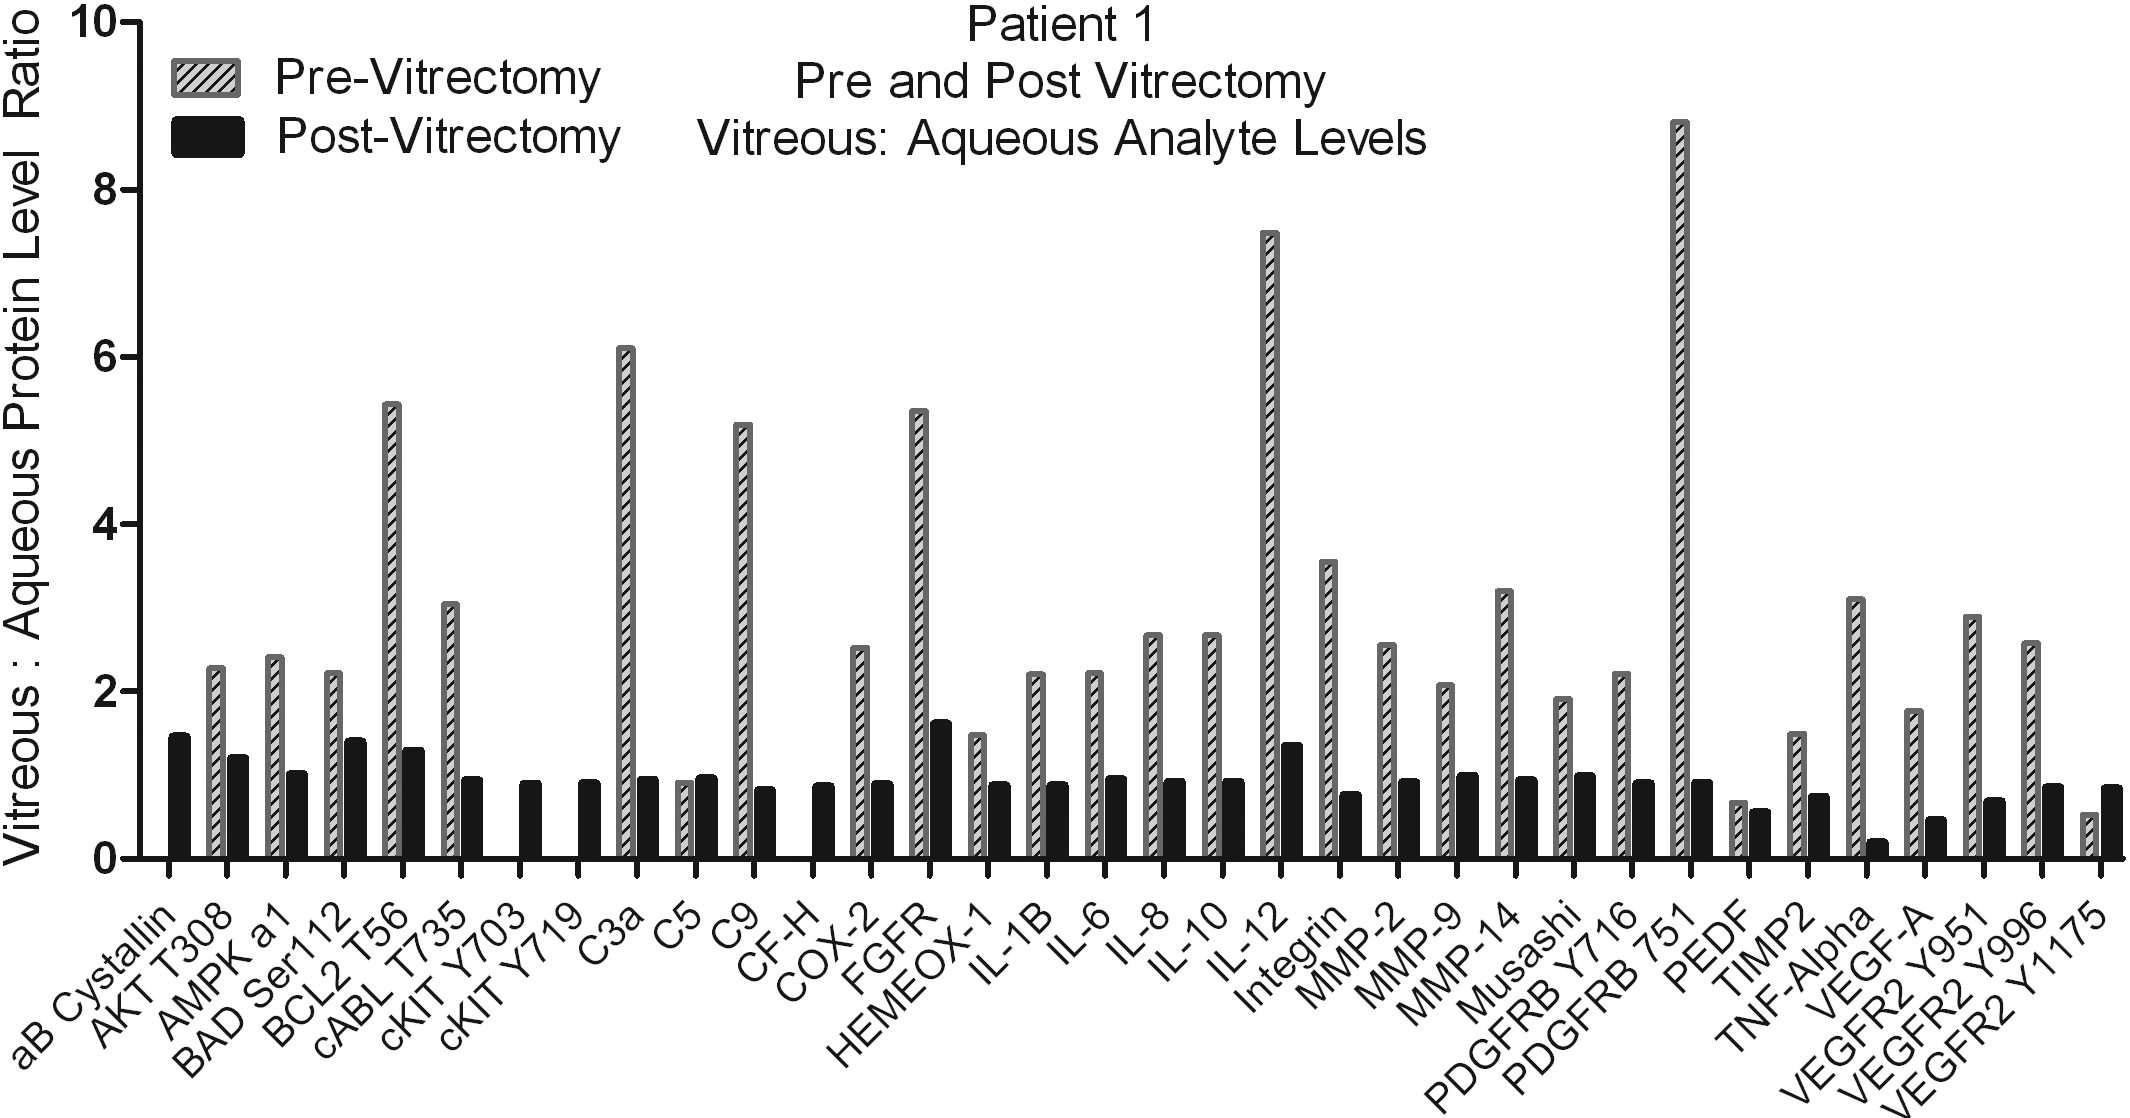
Figure 3.
Represents the difference in the protein level ratios between aqueous and vitreous samples that were taken pre and post vitrectomy (Patient 1 and Patient 1*, respectively).
 Figure 3
of Ecker, Mol Vis 2011; 17:2856-2863.
Figure 3
of Ecker, Mol Vis 2011; 17:2856-2863.