Figure 2 of
Ecker, Mol Vis 2011; 17:2856-2863.
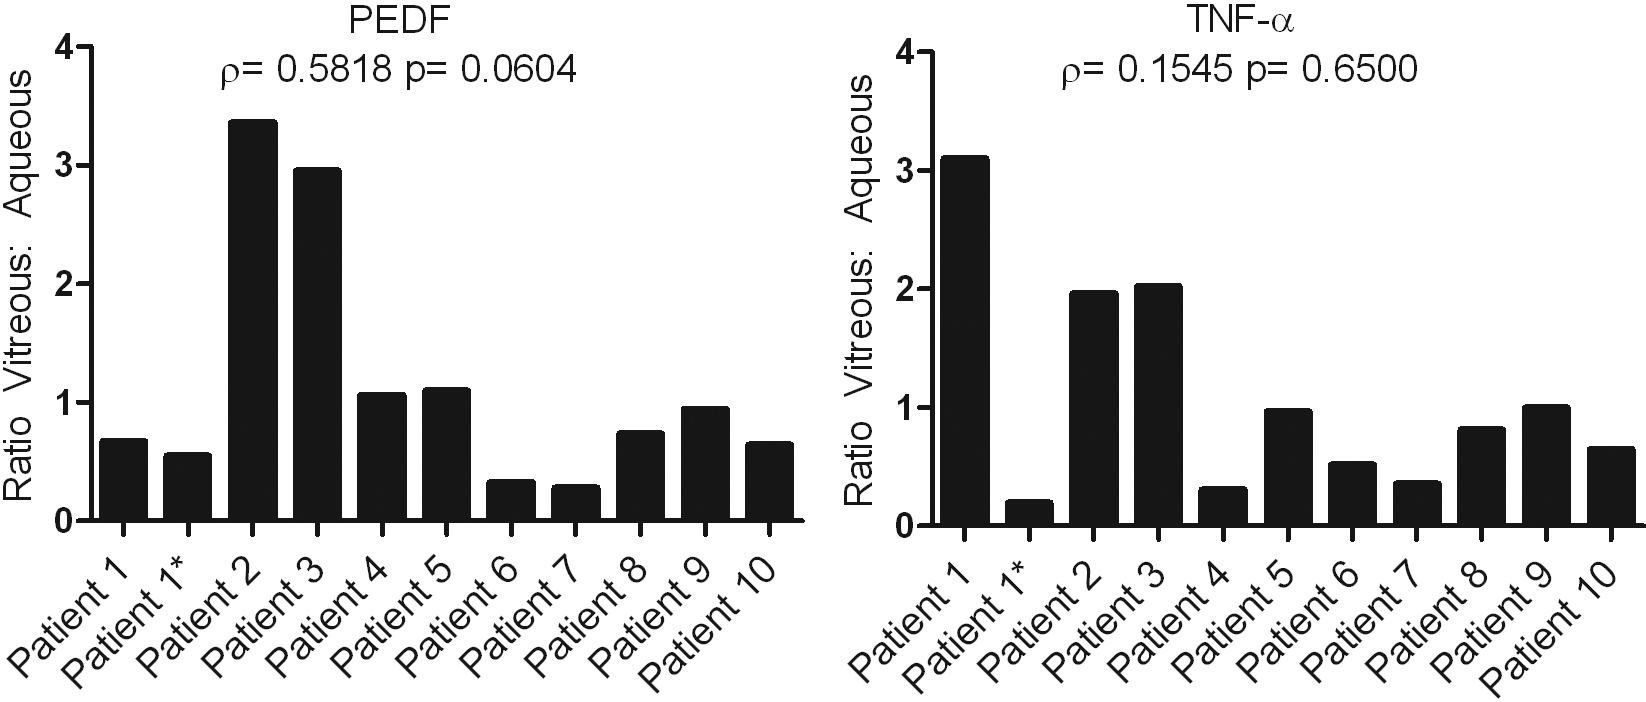
Figure 2.
Graphical representation of the ratio of vitreous to aqueous levels of PEDF and TNF-α. These graphs display the marked difference in correlation of vitreous and aqueous protein levels from patient to patient.
 Figure 2
of Ecker, Mol Vis 2011; 17:2856-2863.
Figure 2
of Ecker, Mol Vis 2011; 17:2856-2863.