Figure 1. Demonstrates how the ratio
of vitreous to aqueous protein levels is relatively constant for
2 proteins that showed a good correlation between the aqueous
and vitreous. Patient 1 has no ratio level for CF-H because
there was no detectable expression of this protein in the
aqueous sample.
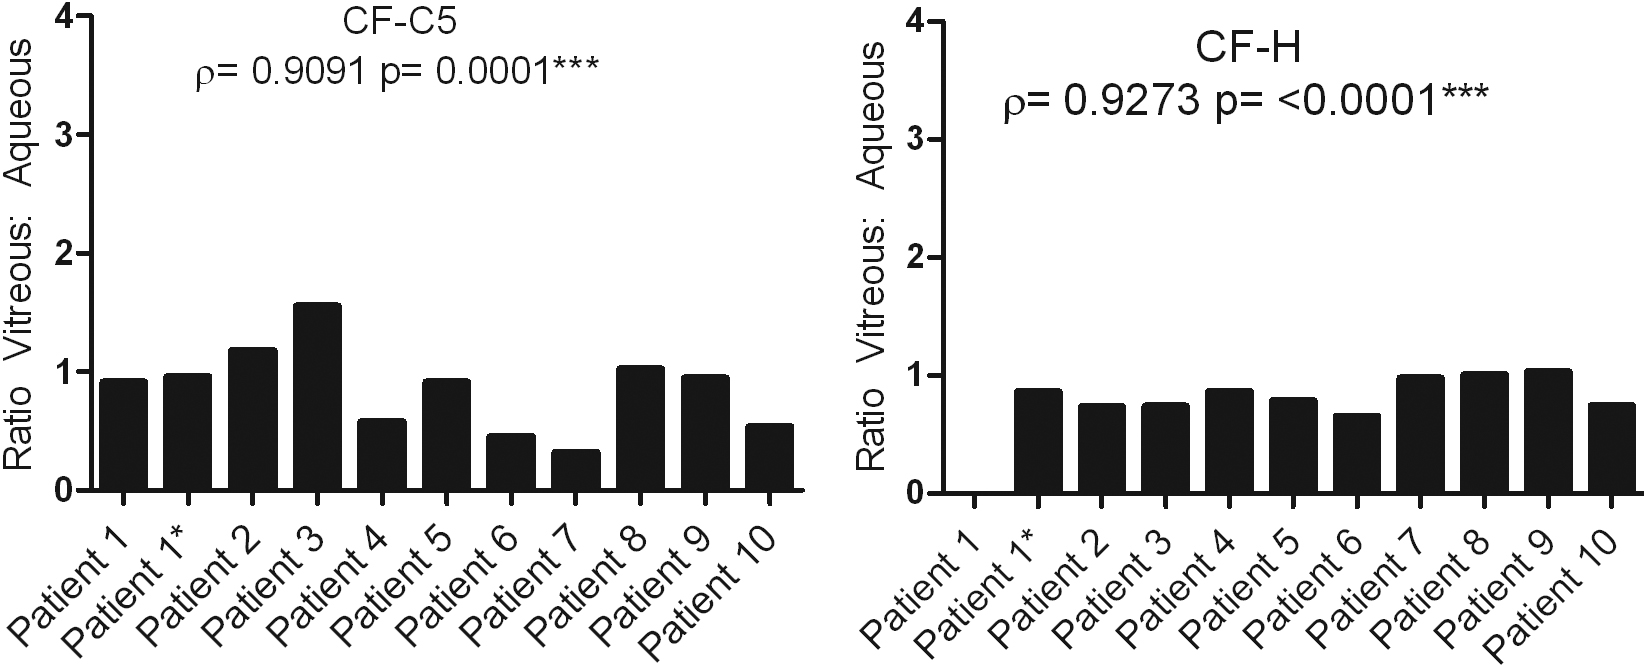
 Figure 1
of Ecker, Mol Vis 2011; 17:2856-2863.
Figure 1
of Ecker, Mol Vis 2011; 17:2856-2863.