Figure 5. Representative images of
transmission electron microscopy. Shown are the flatten microvillis
with larger intervals between them on the cellular surface of
epithelium after BAC treatment (B, black arrows). The
microvillis were sharp with highdense in the control group (A,
black arrows).
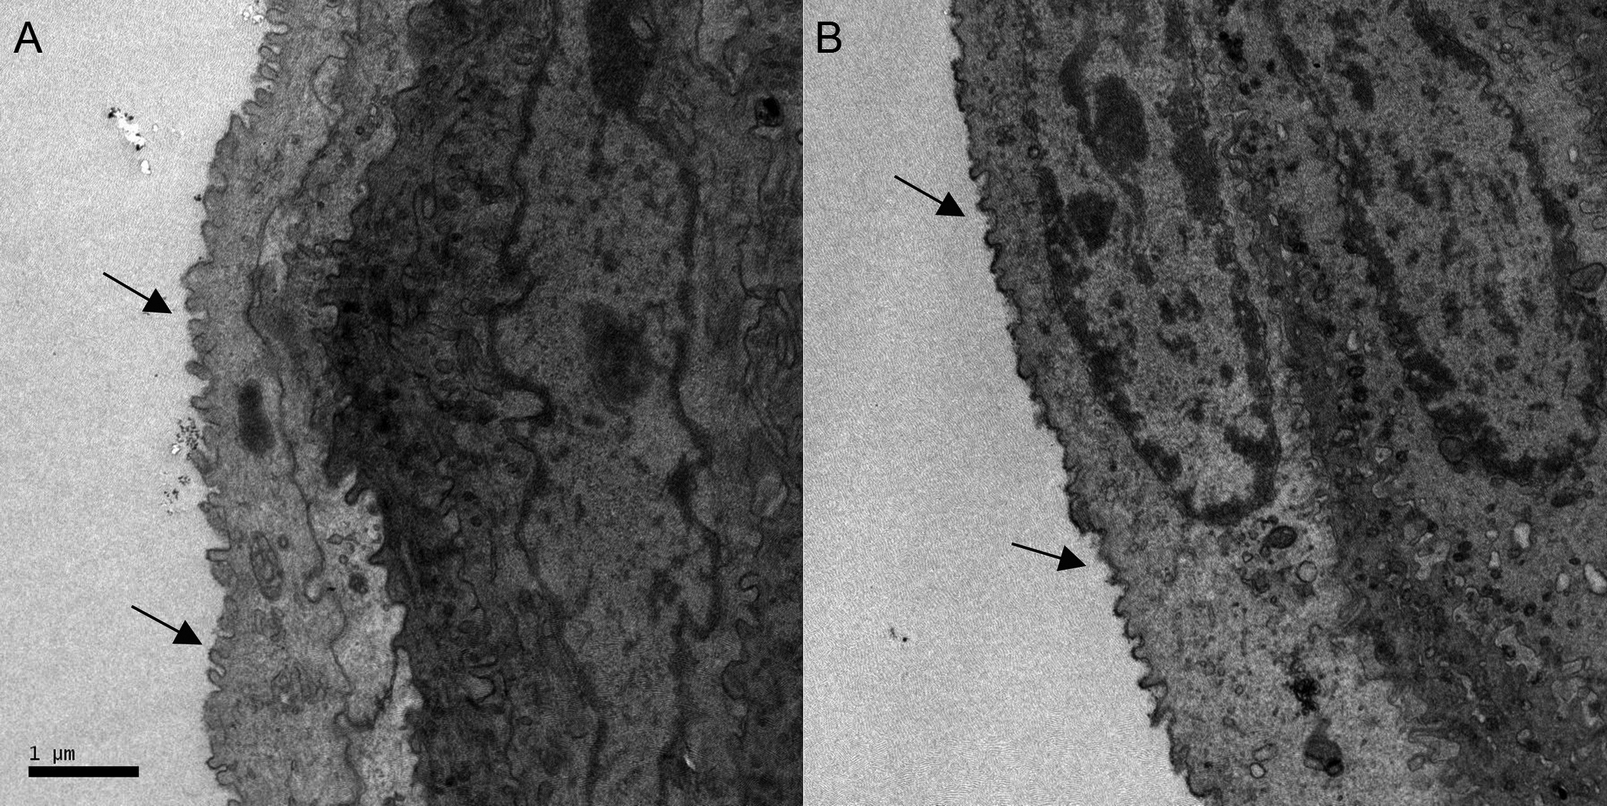
 Figure 5 of Lin, Mol Vis 2011; 17:257-264.