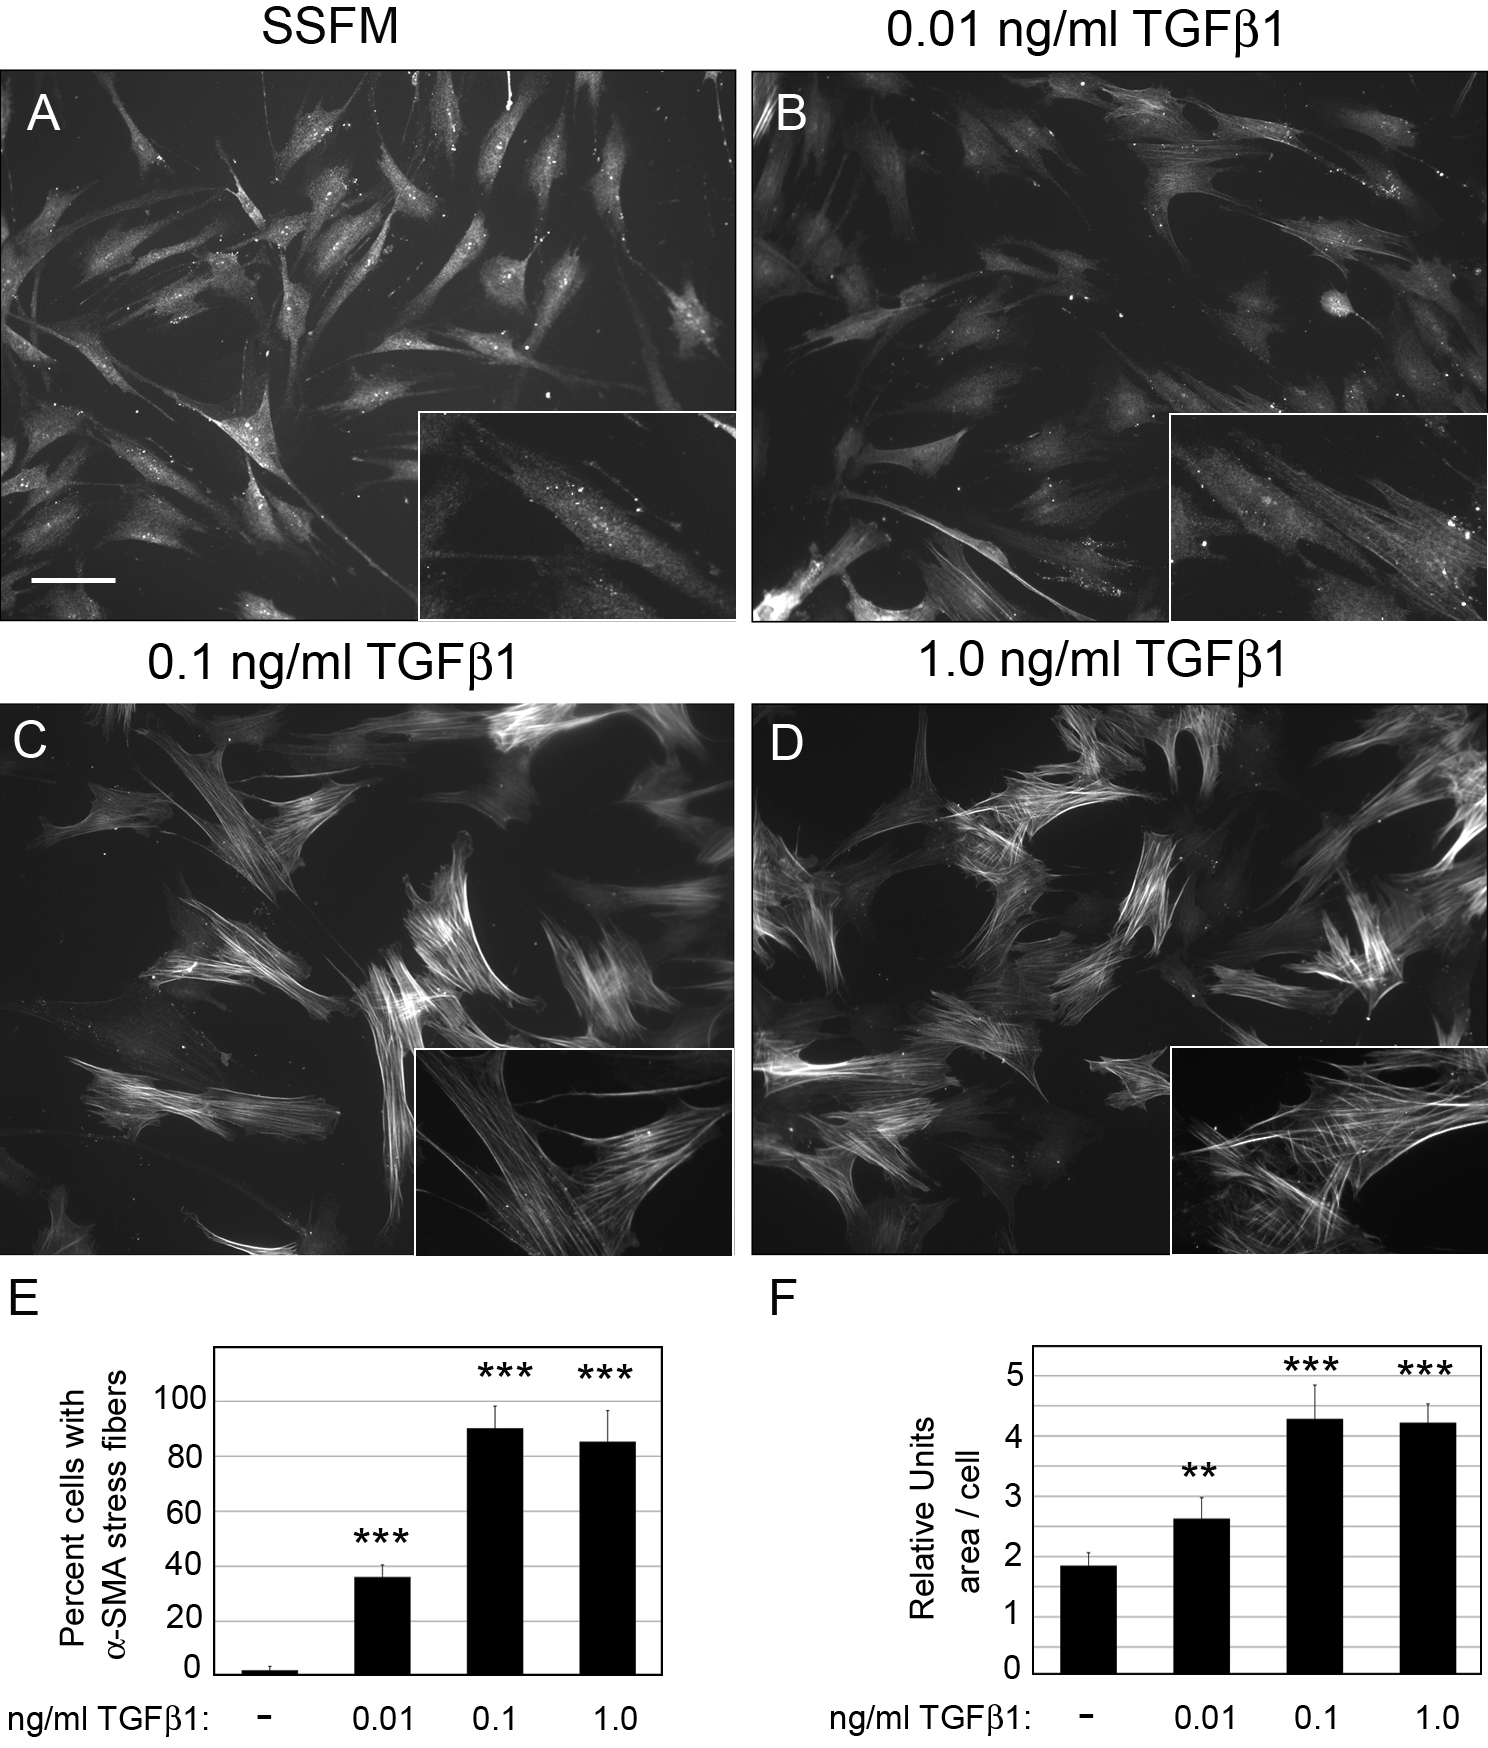
Figure 3. Increasing TGFβ1
concentration promotes fibrotic markers. HCFs were seeded on
collagen in SSFM at 1×10
4 cells/ml on coverslips in a
24 well dish in (
A) SSFM, (
B) 0.01 ng/ml TGFβ1, (
C)
0.1 ng/ml TGFβ1, or (
D) 1.0 ng/ml TGFβ1. After 72 h (
A-
D)
were immunostained for α-SMA. Bar=50 μm. For each condition,
cells containing organized α-SMA stress fibers were counted (
E)
and using
MetaMorph
Analysis the relative cell area was quantified (
F). For
analysis greater than 100 cells per experiment were analyzed.
Each condition was compared to SSFM, **p-value <0.01,
***p-value <0.001. Experiments were repeated at least three
times with similar results.
 Figure 3
of Wang, Mol Vis 2011; 17:2835-2846.
Figure 3
of Wang, Mol Vis 2011; 17:2835-2846.