Figure 1. Retinal DA and DOPAC levels
and the DOPAC/DA ratio in normal control, FDM-only and
defocus-only groups. DA and DOPAC concentrations were determined
in retinal extracts at day 11 of treatment (FDM: deprived eyes;
FDM fel: fellow eyes to deprived eyes; defocus: defocused eyes;
defocus fel: fellow eyes to defocused eyes). The levels of
retinal DA, DOPAC, and the DOPAC/DA ratio were significantly
lower in the deprived eyes compared to their fellow eyes (*
p<0.05, paired sample t-test). The levels of DA and
DOPAC in the deprived eyes were significantly lower than in the
normal control eyes (*p<0.05, one-way ANOVA). In contrast,
the defocus-only group showed similar levels of DA and its
metabolites between eyes of the individual animals (p>0.05,
one-way ANOVA). However, the defocused eyes showed a significant
reduction in retinal DOPAC level but no significant changes in
DA or DOPAC/DA levels when compared to the normal control eyes
(*p<0.05, one-way ANOVA).
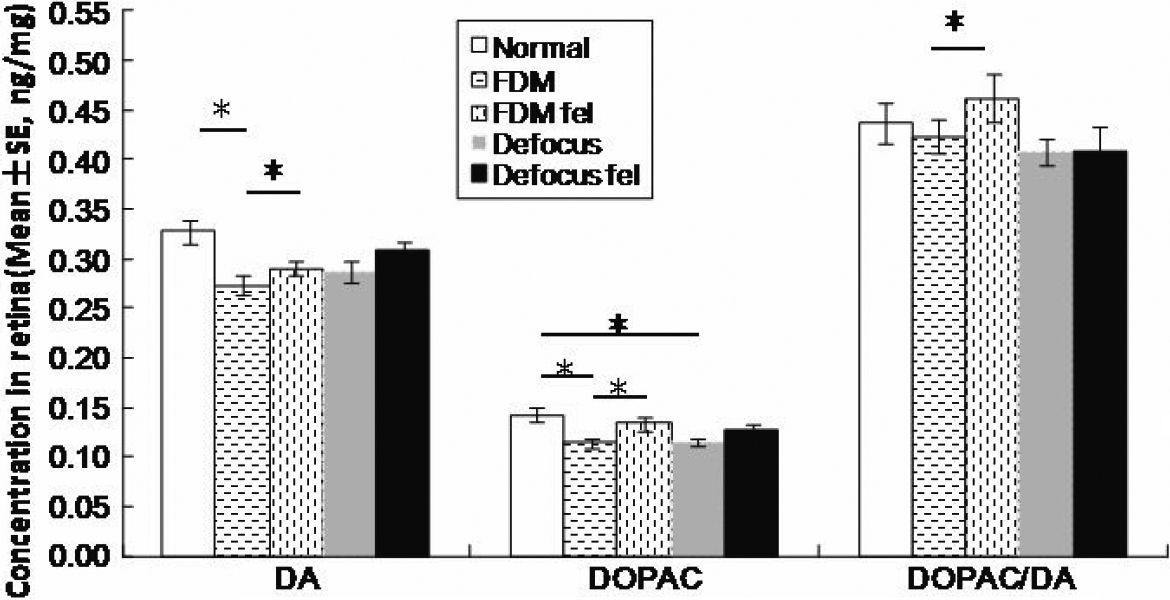
 Figure 1
of Dong, Mol Vis 2011; 17:2824-2834.
Figure 1
of Dong, Mol Vis 2011; 17:2824-2834.