Figure 1. Comparisons of the induction ratio (baseline value divided by after-treatment value) of superoxide anion (O2.-), H2O2, Mn-SOD, Cu,Zn-SOD, catalase, glutathione peroxidase, and GSH/GSSG ratio between normal and GO fibroblasts in response to
the treatment with 200 μM H2O2.
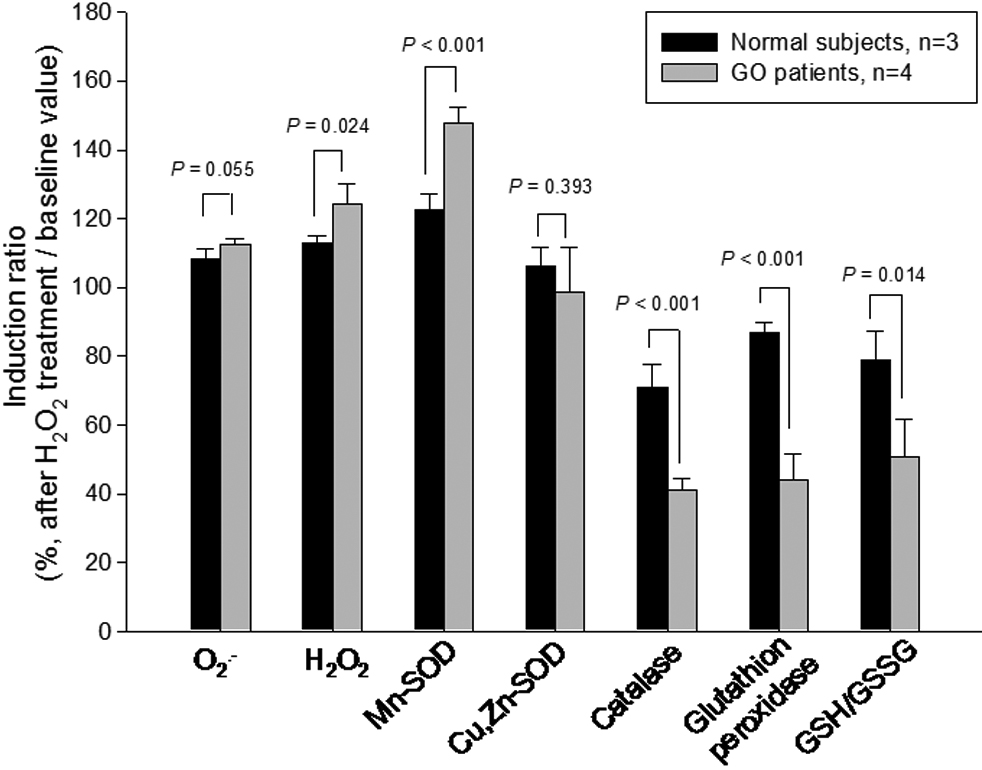
 Figure 1 of
Tsai, Mol Vis 2011; 17:2782-2788.
Figure 1 of
Tsai, Mol Vis 2011; 17:2782-2788.