Figure 4. eIF5A, MMP9, and PCNA
expression in HCEpiCs treated with EGF (control) or EGF+LY294002 were
assessed in this experiment. A: eIF5A, MMP9,
and PCNA gene expression was detected by real-time PCR. The
graph shows the relative eIF5A, MMP9, and PCNA
mRNA levels normalized to ACTB. **p<0.01 versus control
group, ***p<0.001 versus control group. B: The expression of
eIF5A, MMP9, and PCNA protein was measured by using western blot
analysis. The graph shows the relative eIF5A, MMP9, and PCNA protein
levels normalized to β-actin. Results are presented as the
mean±standard deviation of three independent experiments (n=3), each
conducted in triplicate. (**) were highly significant when compared
with control group, in both cases p-value < 0.01, three asterisks
indicate p-value < 0.001 with the Student t test. C: HCEpiCs
were treated with EGF, EGF+eIF5A siRNA, EGF+eIF5A
siRNA+LY294002, and EGF+LY294002. HCEpiCs were treated with 10 µM
LY294002 (PI3-k inhibitor) for 18 h; at 48 h post infection, cells were
stimulated with EGF. After further incubation for 18 h, cells were
subjected to flow cytometric analysis.
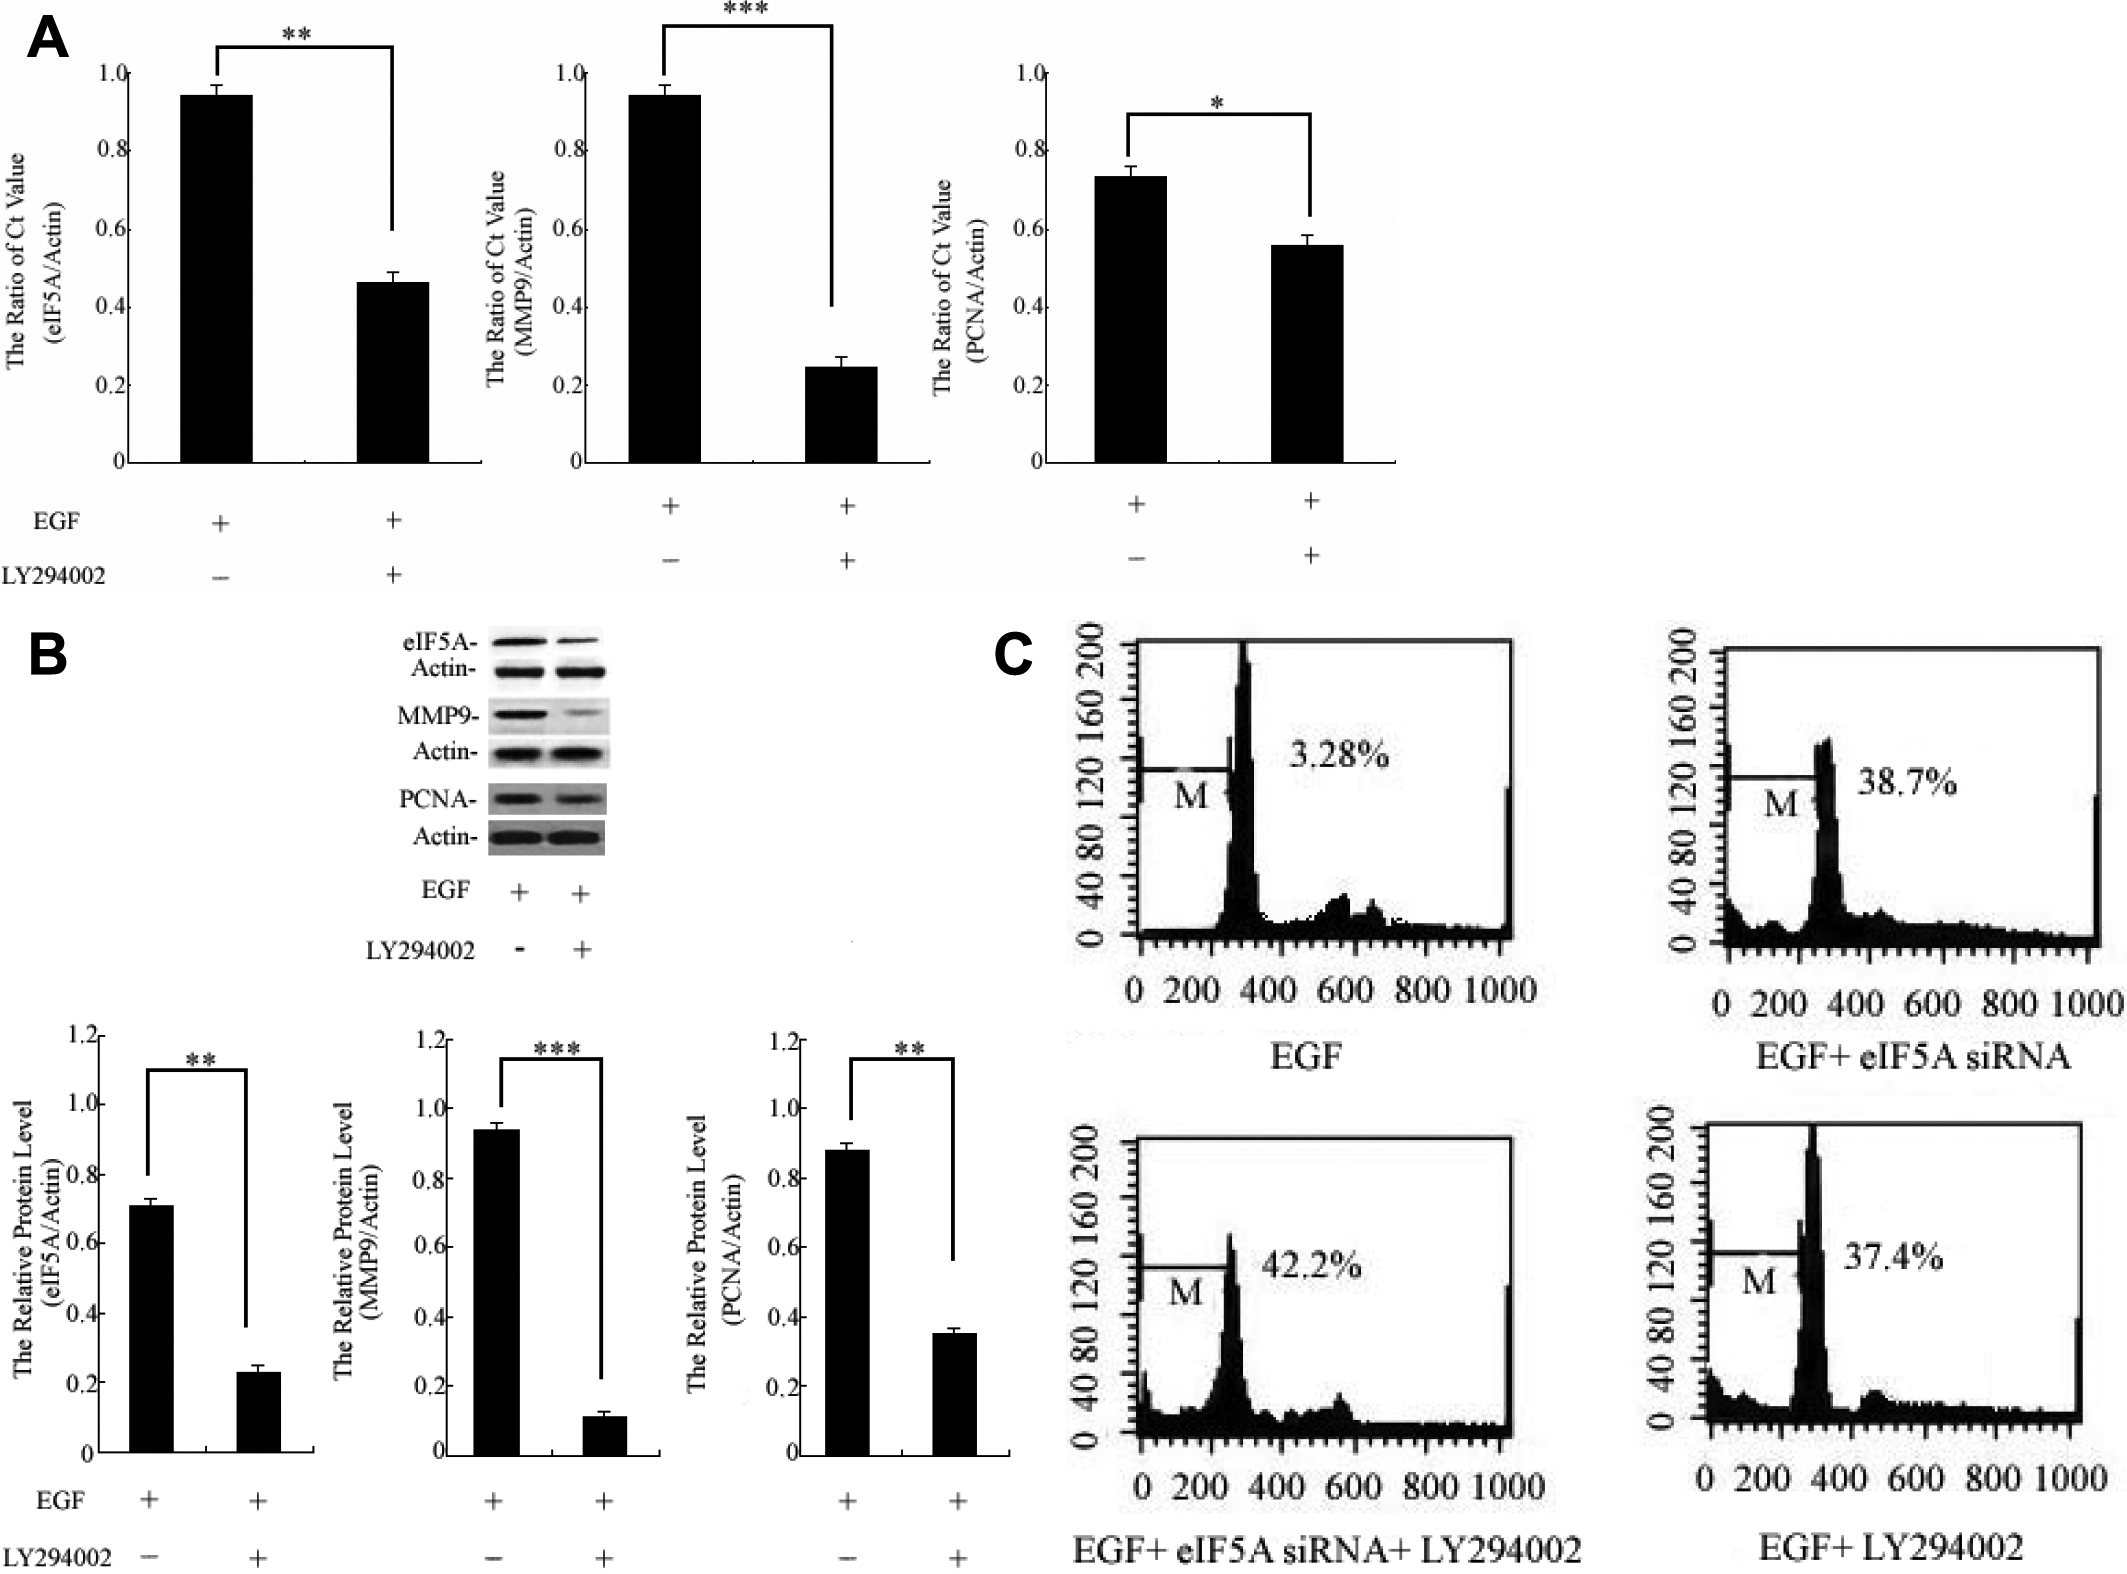
 Figure 4 of Ding, Mol Vis 2011; 17:16-22.