Figure 2. Effects of eIF5A on
matrix metallopeptidase 9 (MMP9), proliferating cell nuclear
antigen (PCNA), and the proliferation of HCEpiCs were assessed
in this study. Cultured HCEpiCs were treated with EGF, EGF+eIF5A
siRNA, eIF5A siRNA, EGF+negative siRNA, and medium alone
(control) for the indicated times. Data were expressed by mean±SD of
three independent experiments. A-B: Relative expressions
of MMP9 mRNA and protein level at 24 h after administration of
different treatments were detected by real-time PCR and western blot,
respectively. The graph shows the relative eIF5A protein levels
normalized to β-actin; data are expressed as mean±standard deviation
(SD) of three independent experiments. (**) were highly significant
when compared with control group, in both cases p-value <0.01,
asterisks indicate p-value <0.05 with the Student t test. C-D:
Relative
expressions of PCNA mRNA and protein level at 36 h
after administration of different treatments were detected by real-time
PCR and western blot, respectively. The graph shows the relative eIF5A
protein levels normalized to β-actin. (**) were highly significant when
compared with control group, in both cases p-value <0.01, asterisks
indicate p-value <0.05 with the Student t test. E:
HCEpiC proliferation at 48 h after administration of different
treatments was detected by 3H-TdR. Data were expressed as
mean±SD of three independent experiments. **p<0.01 versus control
group, asterisks indicate p<0.05 in t test.
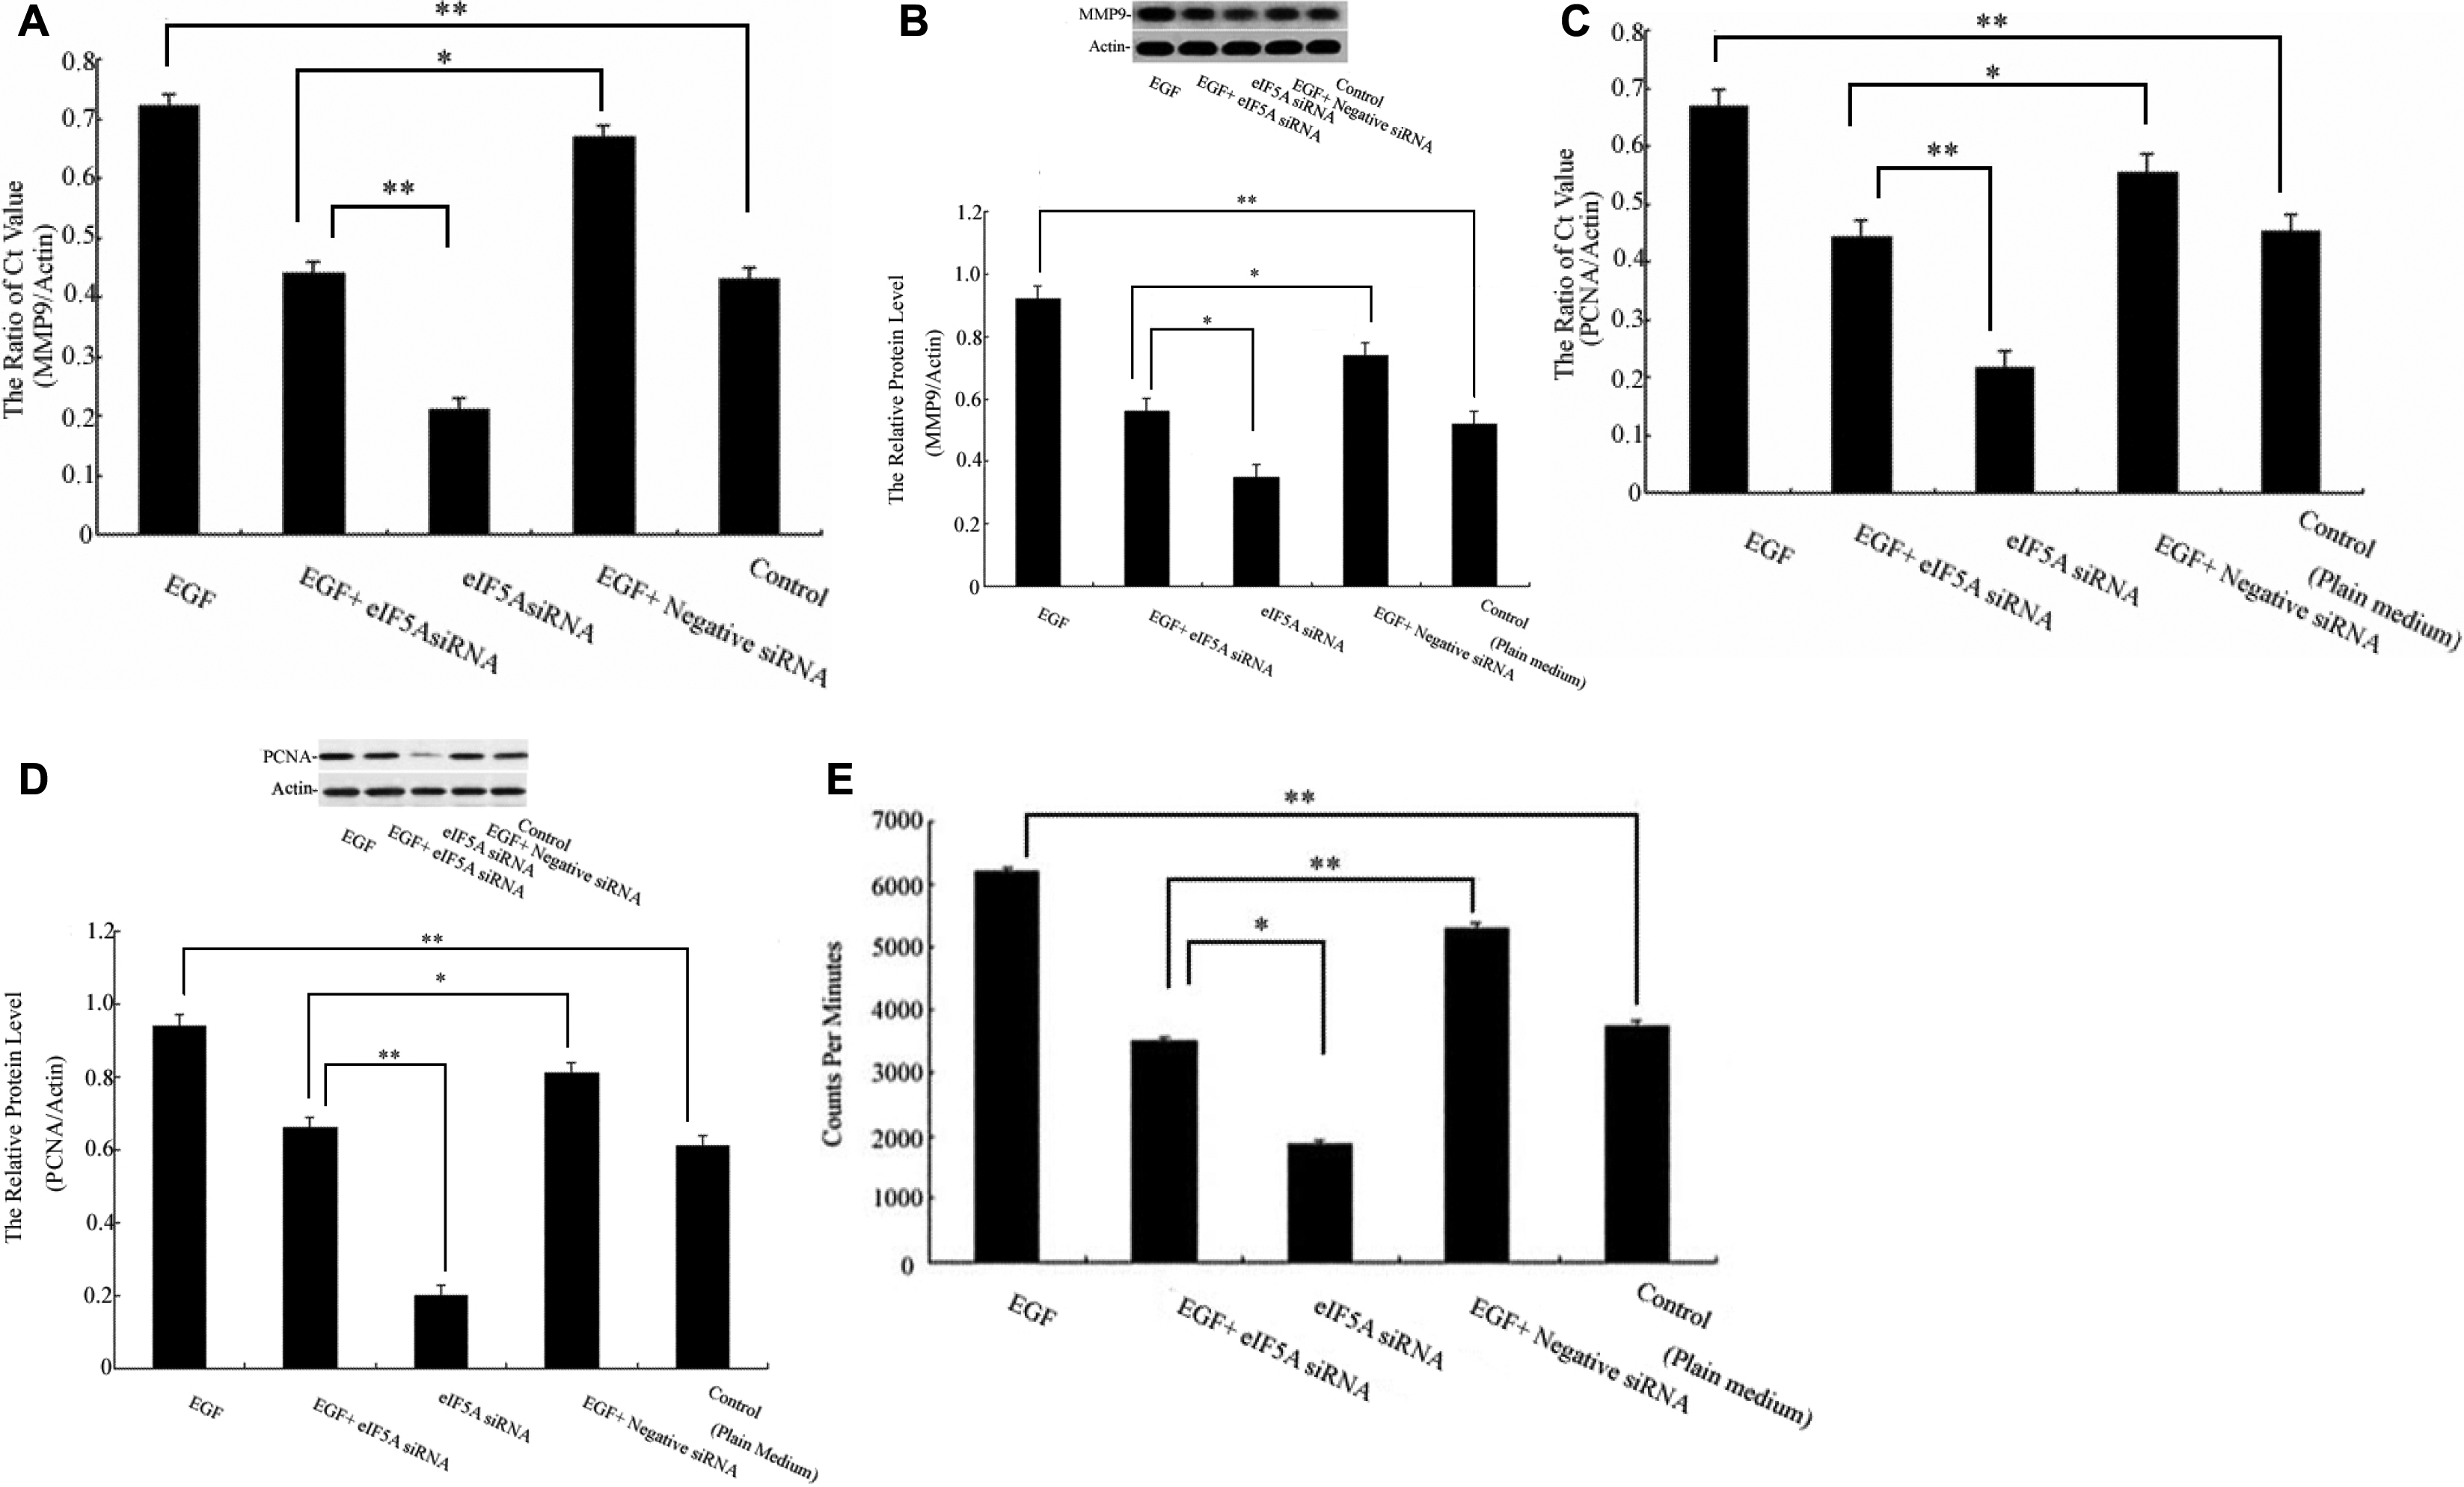
 Figure 2 of Ding, Mol Vis 2011; 17:16-22.