Figure 1. Eukaryotic translation
initiation factor 5A (eIF5A) expression in human corneal
epithelial cells (HCEpiC) was assessed in this experiment. A:
Relative eIF5A gene expression levels at 18 h after
administration of epidermal growth factor (EGF; 10 ng/ml) and medium
alone (control) was detected by real-time polymerase chain reaction
(PCR). The amplification plot of eIF5A and β-actin (ACTB)
are
shown. The graph shows the relative eIF5A protein levels normalized
to β-actin. (**) were highly significant when compared with control
group, in both cases p-value <0.01. B: The expression of
eIF5A protein was measured by using western blot analysis. The graph
shows the relative eIF5A protein levels normalized to β-actin. Results
are presented as the mean±standard deviation of three independent
experiments (n=3), each conducted in triplicate. (**) were highly
significant when compared with control group, in both cases p-value
<0.01.
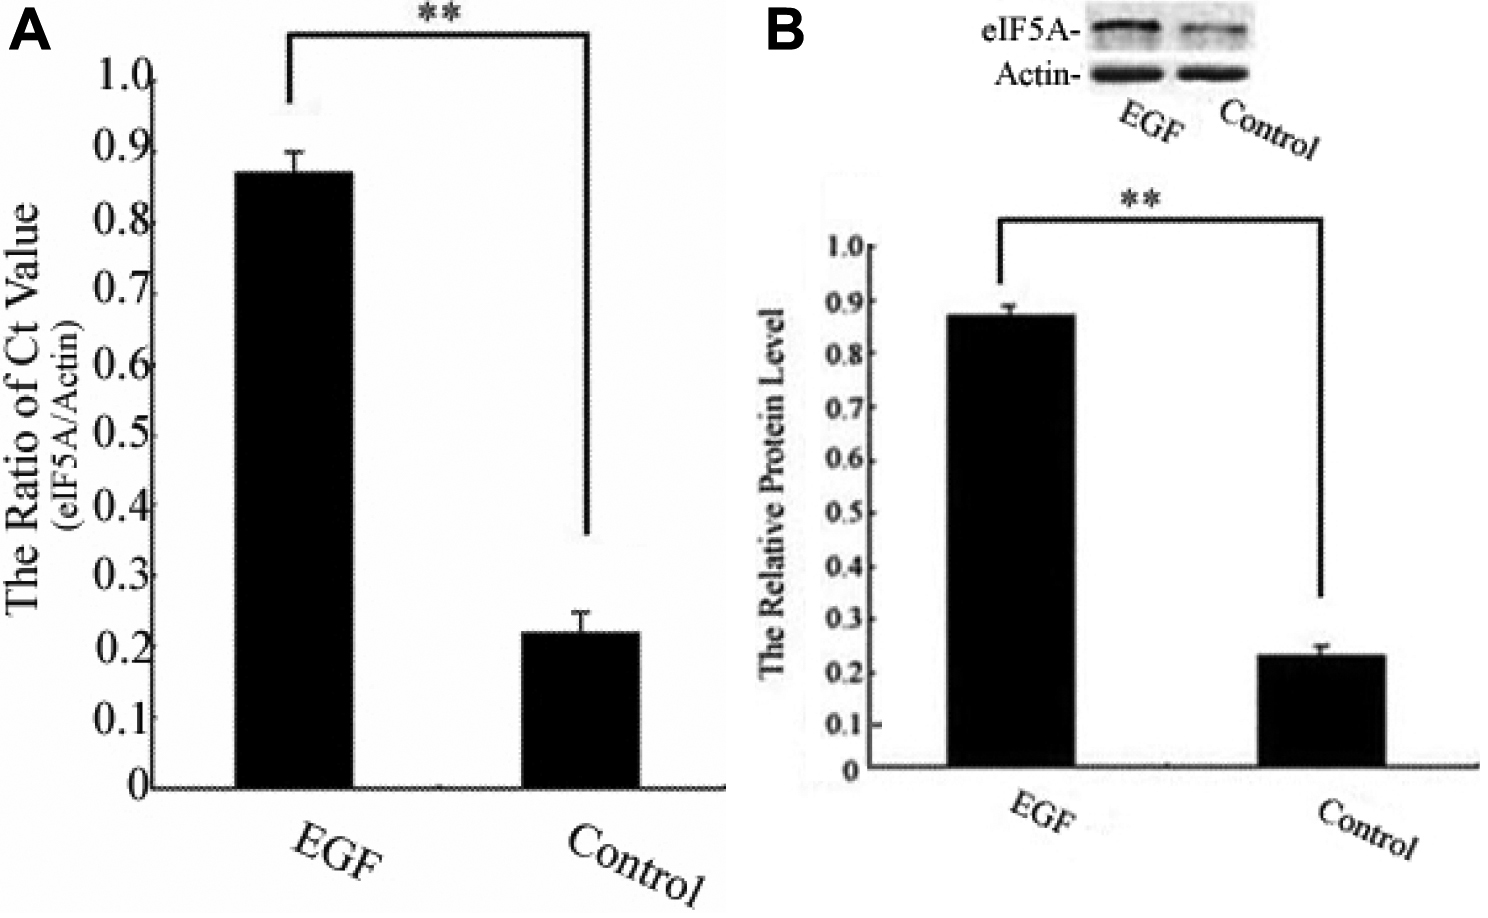
 Figure 1 of Ding, Mol Vis 2011; 17:16-22.