Figure 2 of
Luck, Mol Vis 2011; 17:2759-2764.
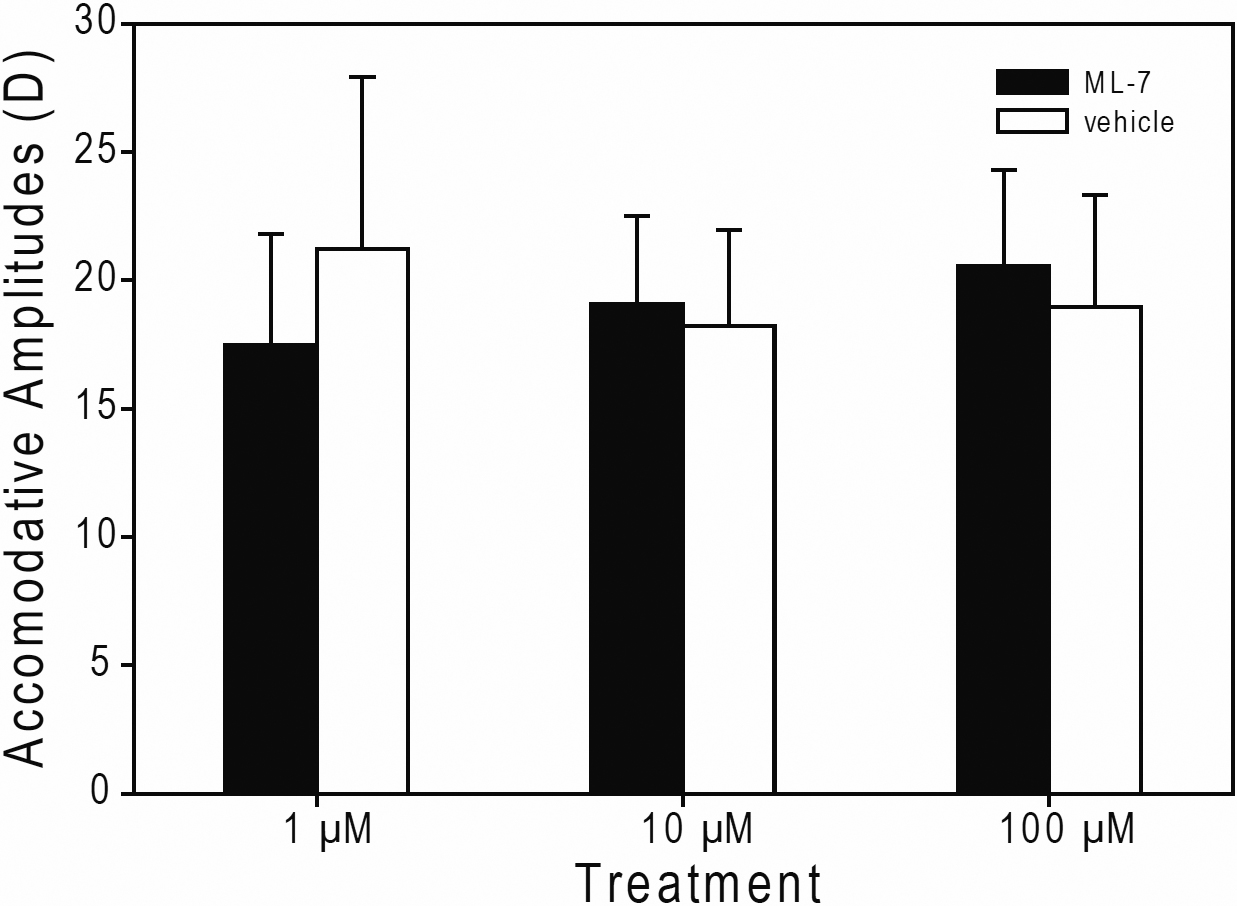
Figure 2.
Effects of ML-7 on accommodative amplitudes (±s.e.m). Bar graphs show the accommodative amplitudes of 1 µM (n=4), 10 µM (n=12), and 100 µM (n=9) ML-7-treated (filled bars) and vehicle-treated (empty bars) eyes, respectively.
 Figure 2 of
Luck, Mol Vis 2011; 17:2759-2764.
Figure 2 of
Luck, Mol Vis 2011; 17:2759-2764.