Figure 10. DLAD staining and imaging was done on eye sections with Nagata antibody to native DLAD as described in the Methods. A: Typical DLAD immunofluorescence (Green, red arrows) of cortical nuclei (blue) from 2 different 3 month old C57BL/6 mice
lenses, 630× original magnification. Green DLAD circles were only seen in cortical nuclei at the deepest levels before digestion.
B: Similar staining of 28 month old C57BL/6 mice lenses. Note lack of green DLAD circles on blue nuclei. Yellow arrows show
direction of lens surface. C: Comparison of the total number or cortical nuclei (per lens) stained with DLAD antibody in 3 month vs 28 month C57BL/6 mice
lenses. One lens from each of 4 different c57BL/6 mice at 3 months and at 28 months were analyzed for comparison. The green
stippling is background staining. Error bars represent the standard errors of the means. The p value is for a 1-tailed Ttest
comparing four animals of each age.
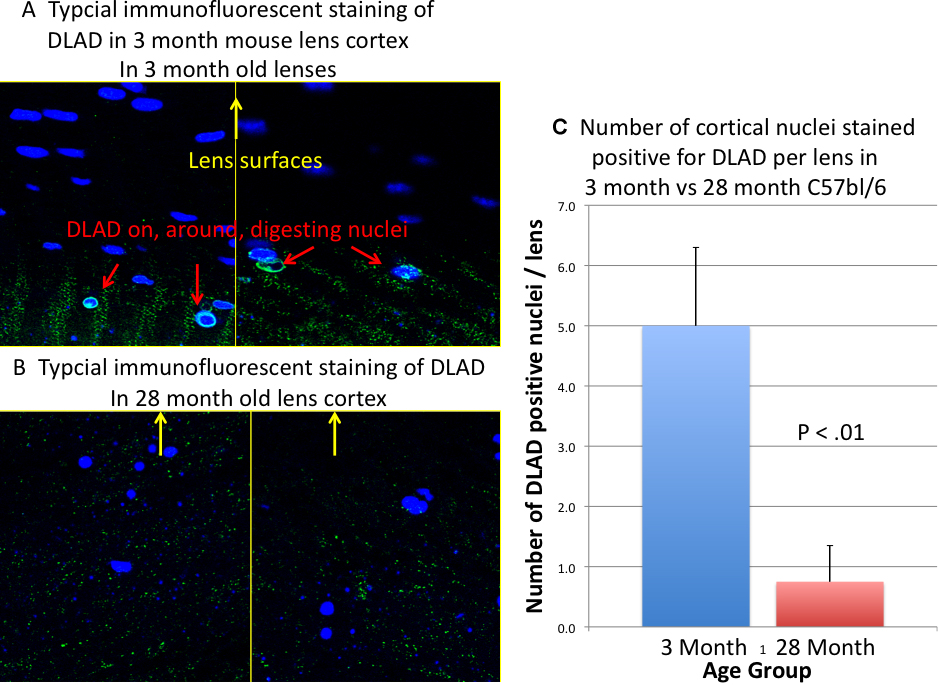
 Figure 10 of
Pendergrass, Mol Vis 2011; 17:2672-2684.
Figure 10 of
Pendergrass, Mol Vis 2011; 17:2672-2684.