Figure 1 of
Mookherjee, Mol Vis 2011; 17:2618-2627.
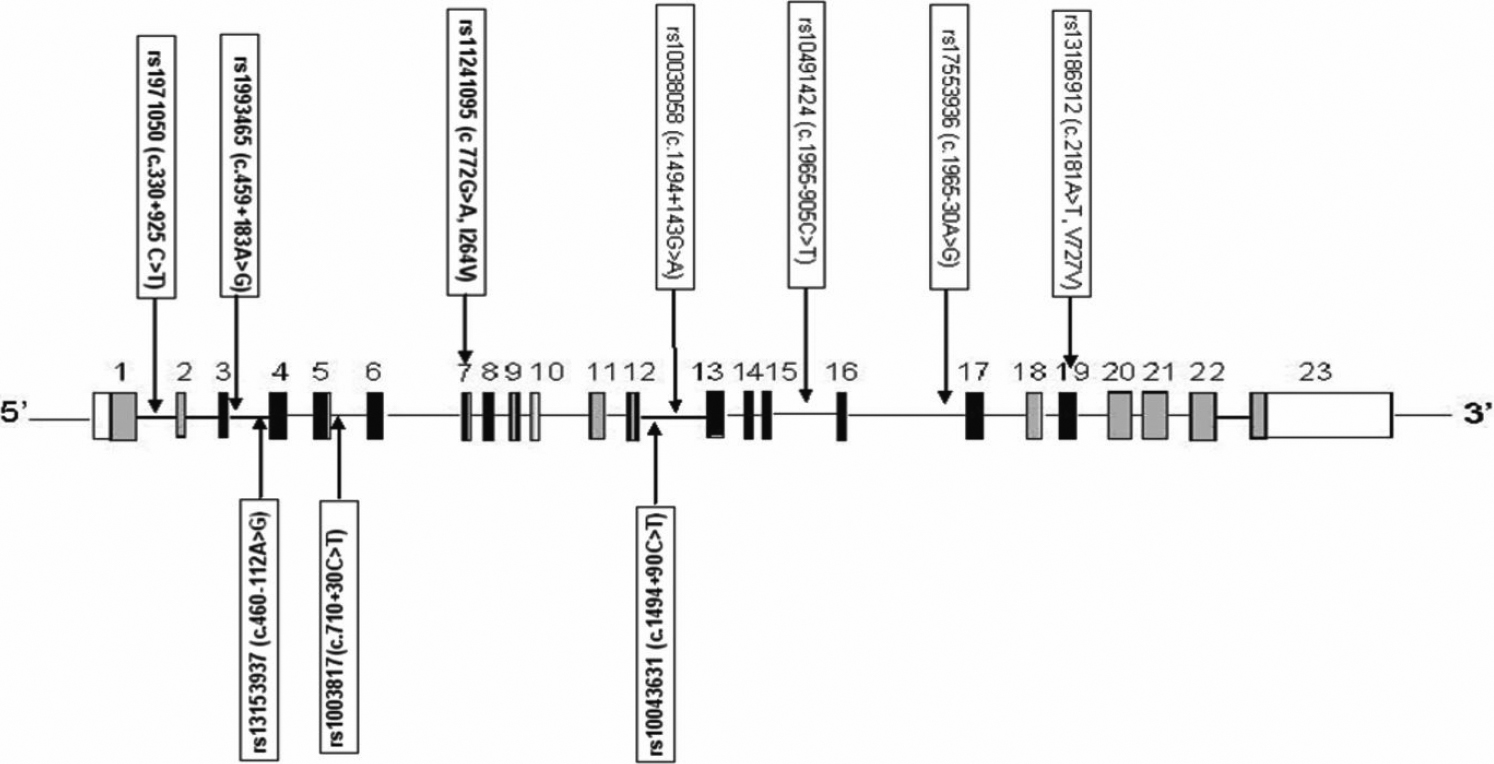
Figure 1.
Schematic representation of
WDR36
with the location of SNPs selected for the study. The sizes of exons and introns shown in the illustration are not according to scale.
 Figure 1
of Mookherjee, Mol Vis 2011; 17:2618-2627.
Figure 1
of Mookherjee, Mol Vis 2011; 17:2618-2627.