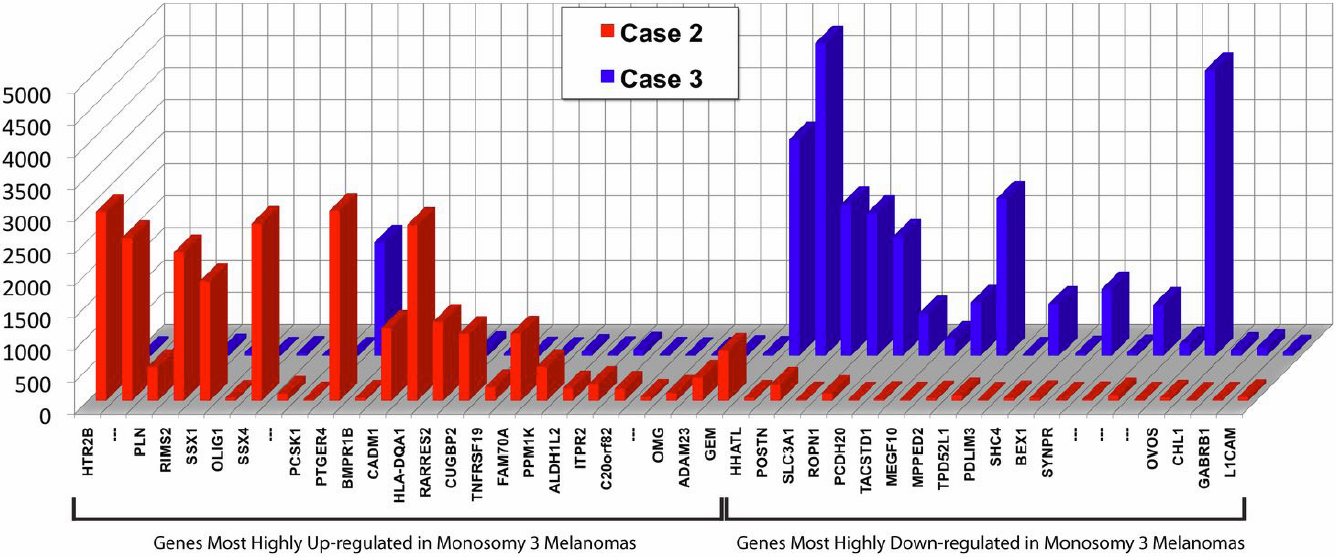
Figure 5. Expression Array Data Comparison
of Two Cases. Normalized GeneChip Human U133 Plus 2.0 expression array
data comparing Case 2 and Case 3 for mRNA expression in the 25 most
highly upregulated genes and 20 most down-regulated genes identified in
a previous study of monosomy 3 choroidal melanomas relative to
chromosome 6p gain choroidal melanomas [
11]. Insufficient RNA was available for
analysis of Case 1.
 Figure 5 of McCannel, Mol Vis 2011; 17:231-236.
  Figure 5 of McCannel, Mol Vis 2011; 17:231-236.