Figure 5 of
Khan, Mol Vis 2011; 17:2570-2579.
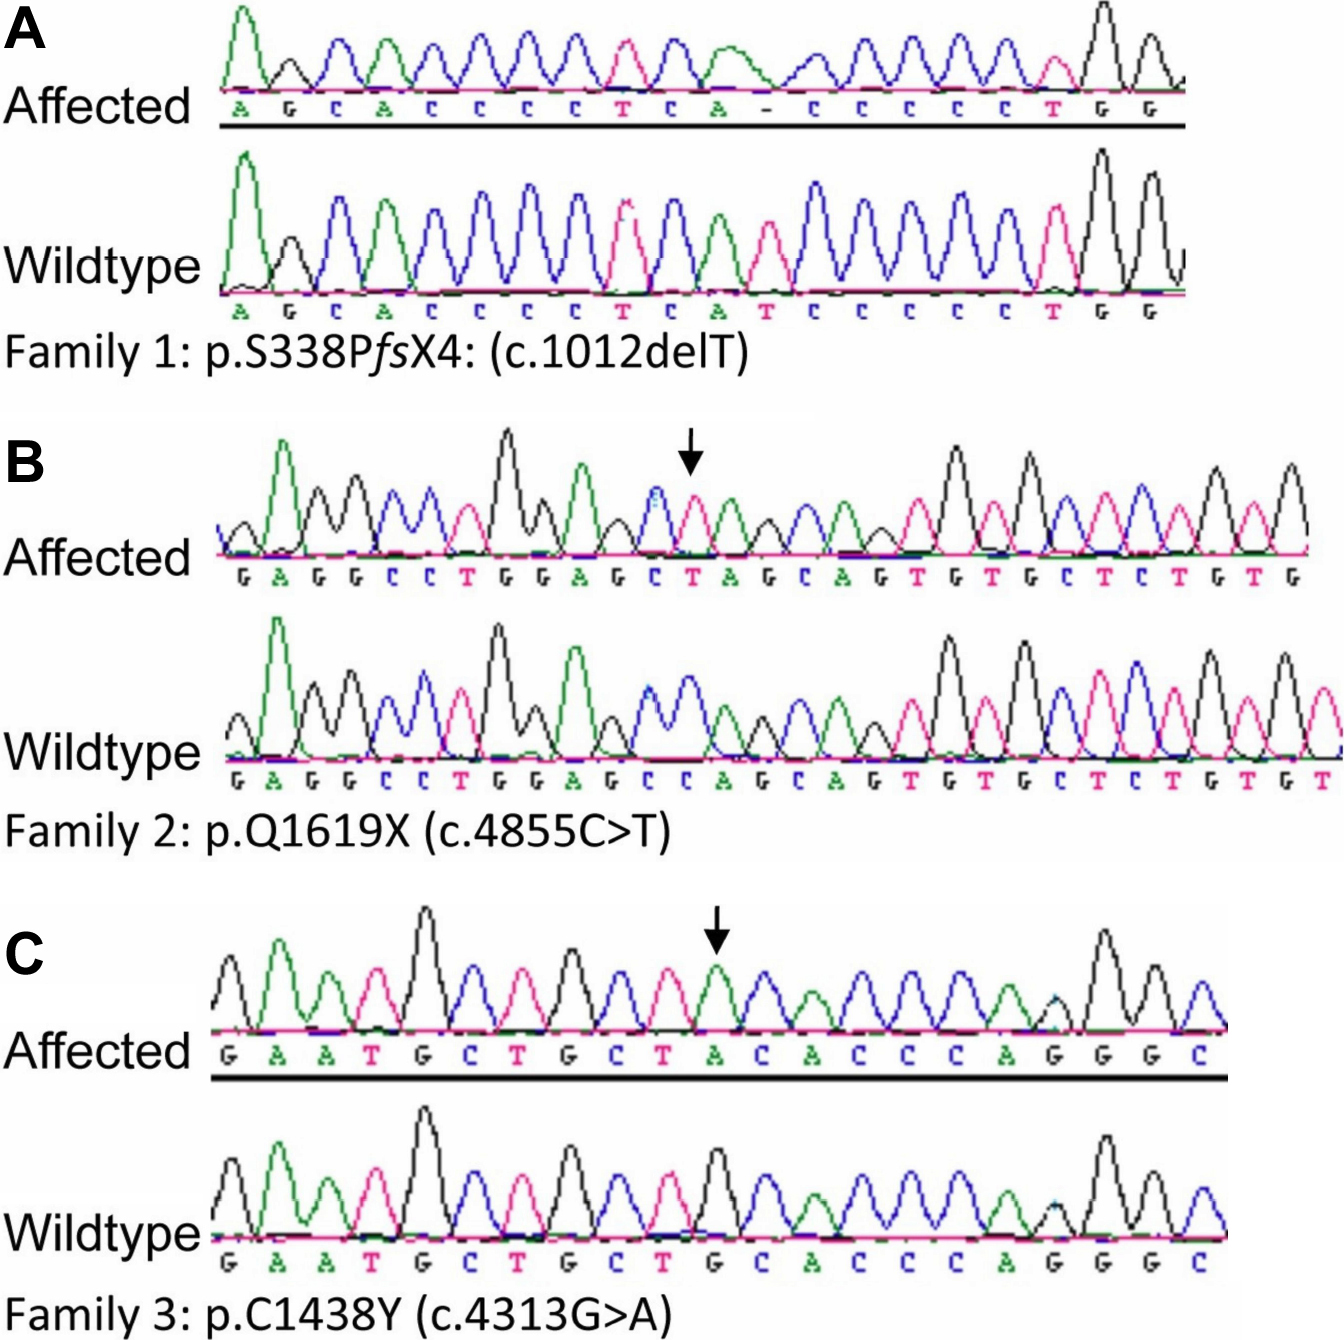
Figure 5.
Genetic analysis.
A
,
B
,
C
: Sequencing of
LTPB2
revealed a novel homozygous mutation in each family that segregated with the phenotypes.
 Figure 5 of
Khan, Mol Vis 2011; 17:2570-2579. Figure 5 of
Khan, Mol Vis 2011; 17:2570-2579.
Figure 5 of
Khan, Mol Vis 2011; 17:2570-2579. Figure 5 of
Khan, Mol Vis 2011; 17:2570-2579.