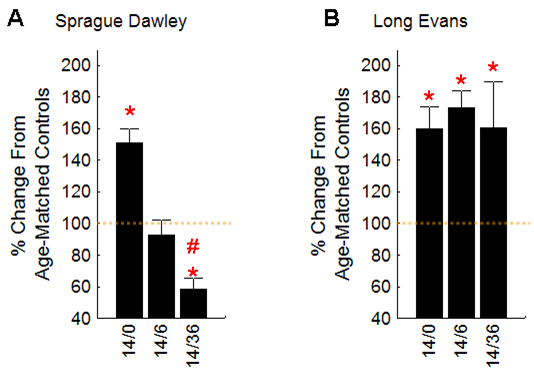
Figure 2. Summary of intraretinal manganese uptake time course data. Data are presented for outer retina as a percent change from age-controls
(dotted orange line) for
A: Sprague Dawley (SD) rats and
B: variable oxygen (VO) rats. Inner retinal (IR) patterns were similar to these (outer retina) OR patterns. See
Table 1 for numbers of rats investigated (n’s). Percent change from mean control and variable oxygen (VO) groups were calculated
after subtraction of mean nonmanganese baseline values (50 arbitrary units (a.u.) for 4.7 T data and 0.65 s
−1 for 7 T data). Error bars represent the SEM of only the VO animals. The * indicate a significant (p<0.05) difference from
control values; the # indicates a significant (p<0.05) difference from the values at 14/0.
 Figure 2 of
Berkowitz, Mol Vis 2011; 17:2516-2526.
Figure 2 of
Berkowitz, Mol Vis 2011; 17:2516-2526.