Figure 6. Cell survival relative to control simulated by using the cellular PK and PD models. S was plotted as a function of the initial
concentration of ECA in the extracellular medium for three different scenarios of topical drug delivery in the eye. (i) ECA
was applied via traditional eye drops (LC50=2330 μM); (ii) ECA was released from a Pluronic® copolymer film (LC50=540 μM); and (iii) ECA concentration at corneal surface was maintained at constant levels for 1,000 h (LC50=35 μM).
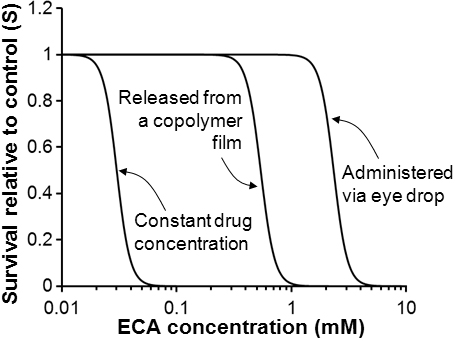
 Figure 6 of
Lin, Mol Vis 2011; 17:2507-2515.
Figure 6 of
Lin, Mol Vis 2011; 17:2507-2515.