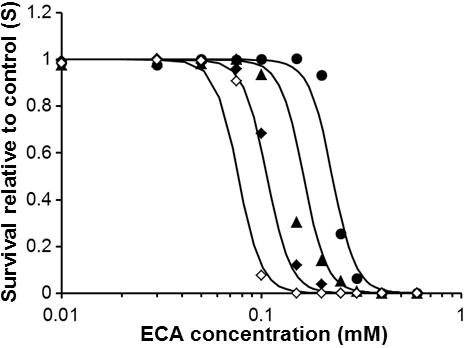
Figure 5. Experimental data of cell survival relative to control (S). It was a function of the initial extracellular concentration of
ECA and the period of treatment. The symbols indicate experimental data and the curves were resulted from fitting the PD model
to the data. ●: 2 h of constant ECA exposure; ▲: 6 h of constant ECA exposure; ◆: 24 h of constant ECA exposure; ◇: 72 h of
ECA exposure. The best-fit values of the model constants are reported in
Table 1.
 Figure 5 of
Lin, Mol Vis 2011; 17:2507-2515.
Figure 5 of
Lin, Mol Vis 2011; 17:2507-2515.