Figure 4 of
Lin, Mol Vis 2011; 17:2507-2515.
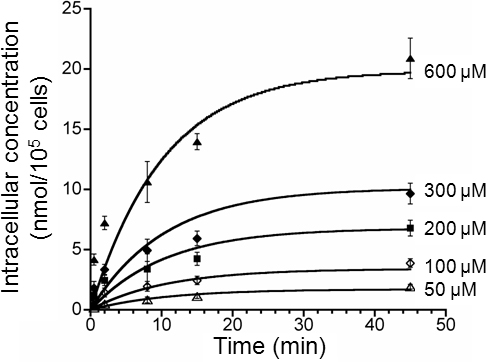
Figure 4.
Time dependent changes in intracellular concentration of ECA. The symbols indicate experimental data and the curves were resulted from fitting the PK model to the data. The best-fit values of the model constants are reported in
Table 1
.
 Figure 4 of
Lin, Mol Vis 2011; 17:2507-2515.
Figure 4 of
Lin, Mol Vis 2011; 17:2507-2515.