Figure 3 of
Lin, Mol Vis 2011; 17:2507-2515.
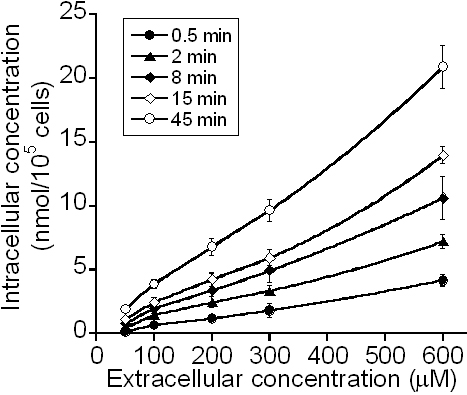
Figure 3.
Intracellular concentration of ECA. It was a function of the initial extracellular concentration of ECA and the period of treatment.
 Figure 3 of
Lin, Mol Vis 2011; 17:2507-2515. Figure 3 of
Lin, Mol Vis 2011; 17:2507-2515.
Figure 3 of
Lin, Mol Vis 2011; 17:2507-2515. Figure 3 of
Lin, Mol Vis 2011; 17:2507-2515.