Figure 1. UV absorbance spectrums of ECA and GSH. The concentrations of ECA and GSH were 50 μM and 600 μM, respectively. The spectrum
curves suggested that ECA concentration should be measured at 270 nm to minimize possible interference with signals from GSH.
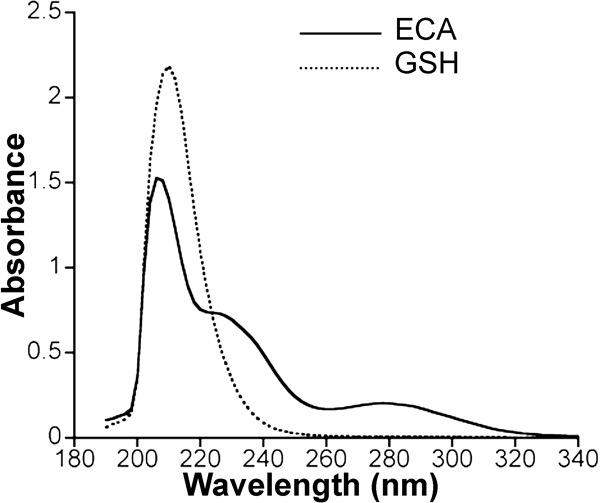
 Figure 1 of
Lin, Mol Vis 2011; 17:2507-2515.
Figure 1 of
Lin, Mol Vis 2011; 17:2507-2515.