Figure 2. Postoperative IOP changes
during a 28 days period in each group. Across all groups, IOP
was at its lowest day 1 post-op, with upward trends starting day
3. Group B and Group D had sharp increases on day 3, surpassing
12 mmHg on day 5, reaching an equilibrium soon after. Group
C had a slower increase, surpassing 12 mmHg on day 10, and
then reaching equilibrium. Group A continually sustains a lower
IOP than pre-op during the observed period. #p<0.05,
※p>0.05 versus pre-op (n=4).
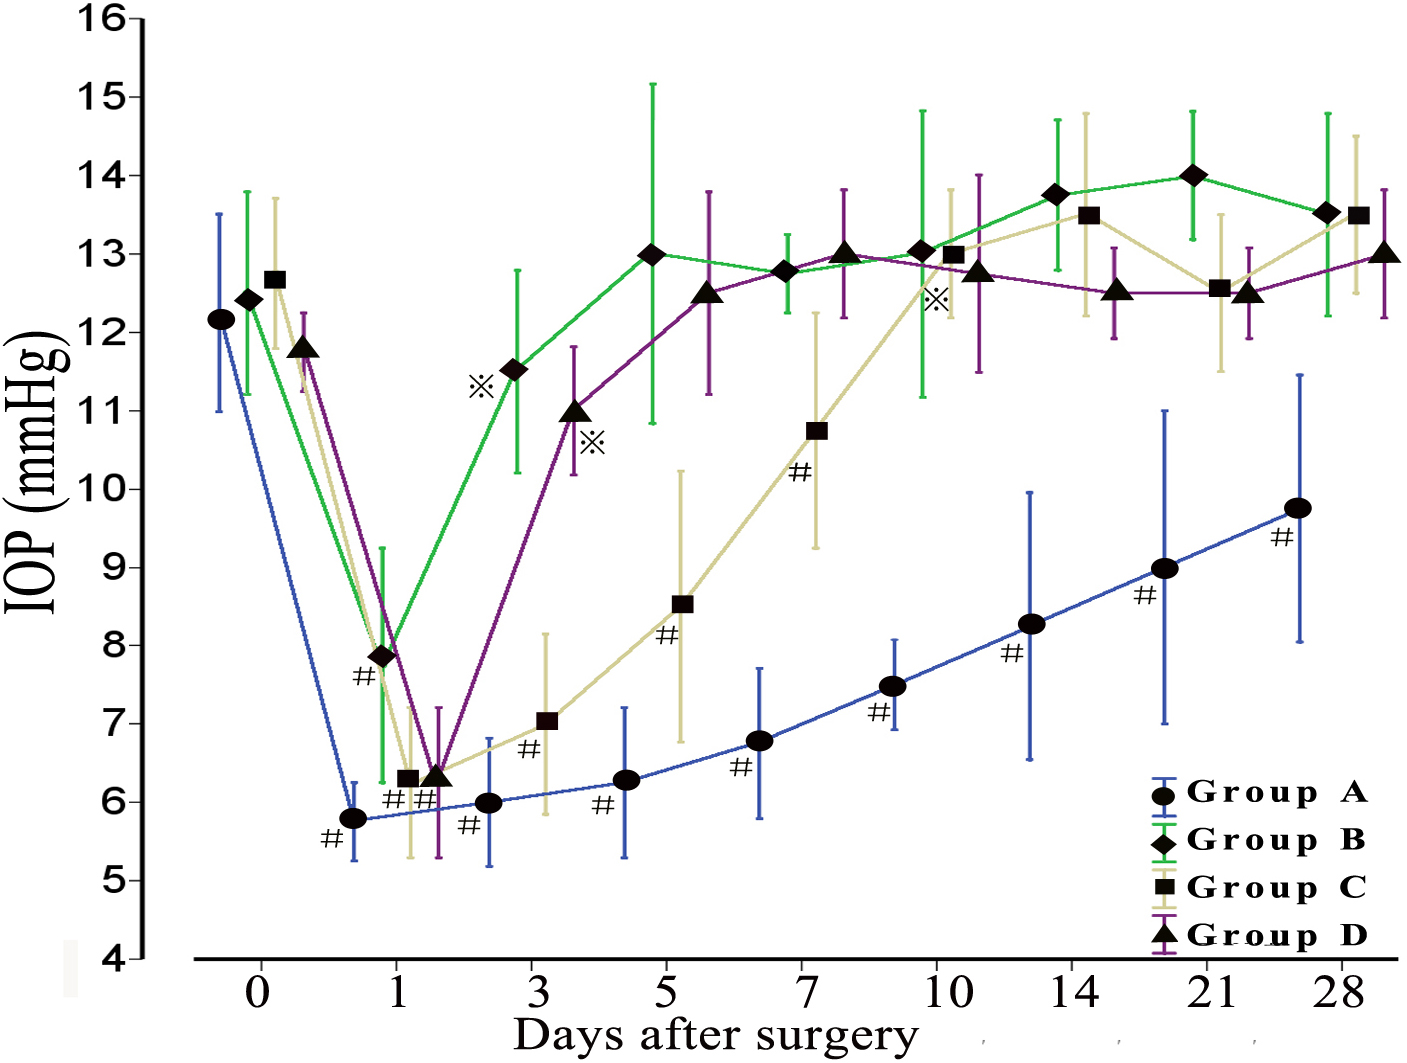
 Figure 2
of Yan, Mol Vis 2011; 17:2495-2506.
Figure 2
of Yan, Mol Vis 2011; 17:2495-2506.