Figure 5. Mitochondrial membrane
potential (MMP) and cell apoptosis assay. A: Summarized
data for MMP change for shRNA treated RCE cells. The ratio of
JC-1 red/green fluorescence represents the MMP. y-axis is the
ratio of JC-1 red to green, which reflects MMP. Data are
normalized with no treatment. MMP for shRNA treated cells
relative to that of no treatment (NT). B: Summarized
data from the Annexin V-FITC (AnV) cell apoptosis assay results.
Annexin V-FITC intensity was normalized to protein
concentration.
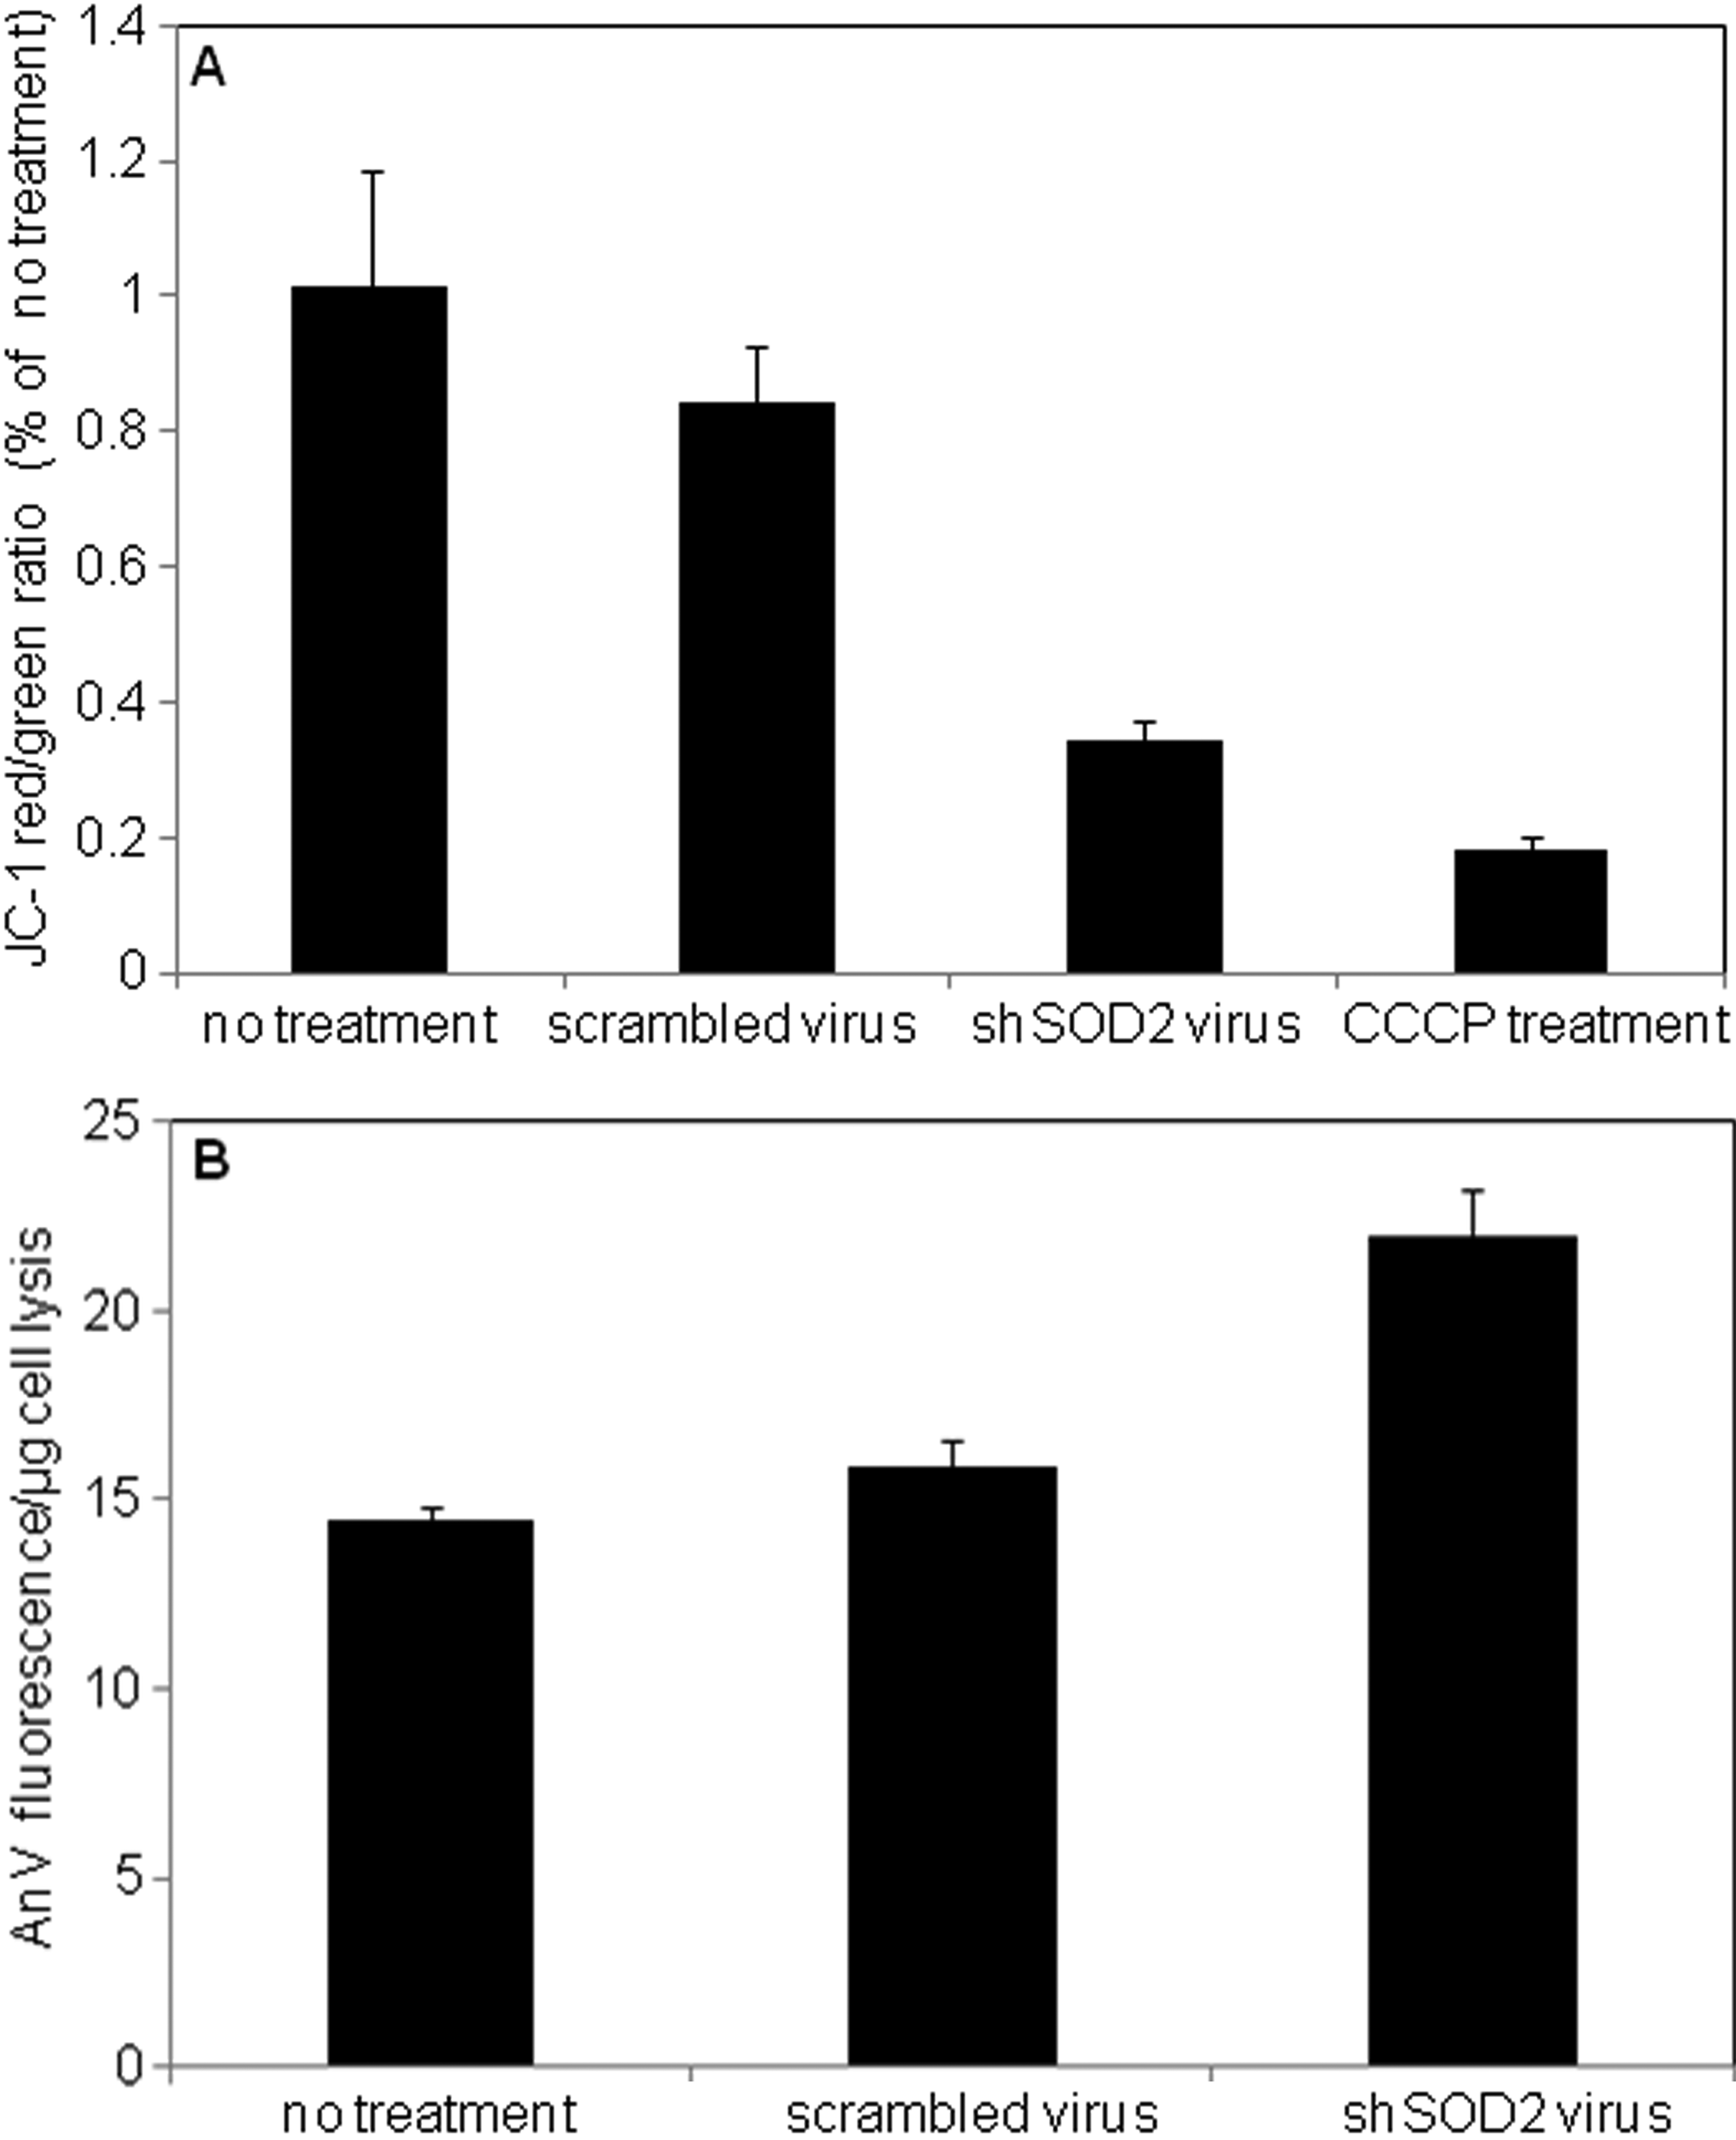
 Figure 5
of Liu, Mol Vis 2011; 17:2473-2481.
Figure 5
of Liu, Mol Vis 2011; 17:2473-2481.