Figure 4. ROS production assay. A:
MitoSOX™ microscopy ROS detection for siRNA treated RCE cells
(200×). B: A representative histogram of ROS production
for control, scrambled virus-treated and shRNA-treated cells
with and without 2 min UV exposure. An increase in relative
fluorescence is reflected with a rightwards shift in x-axis in
line histograms. The % of Max is the number of cells in each bin
divided by the number of cells in the bin that contains the
largest number of cells. C: Summary data for DCF flow
cytometry ROS detection.
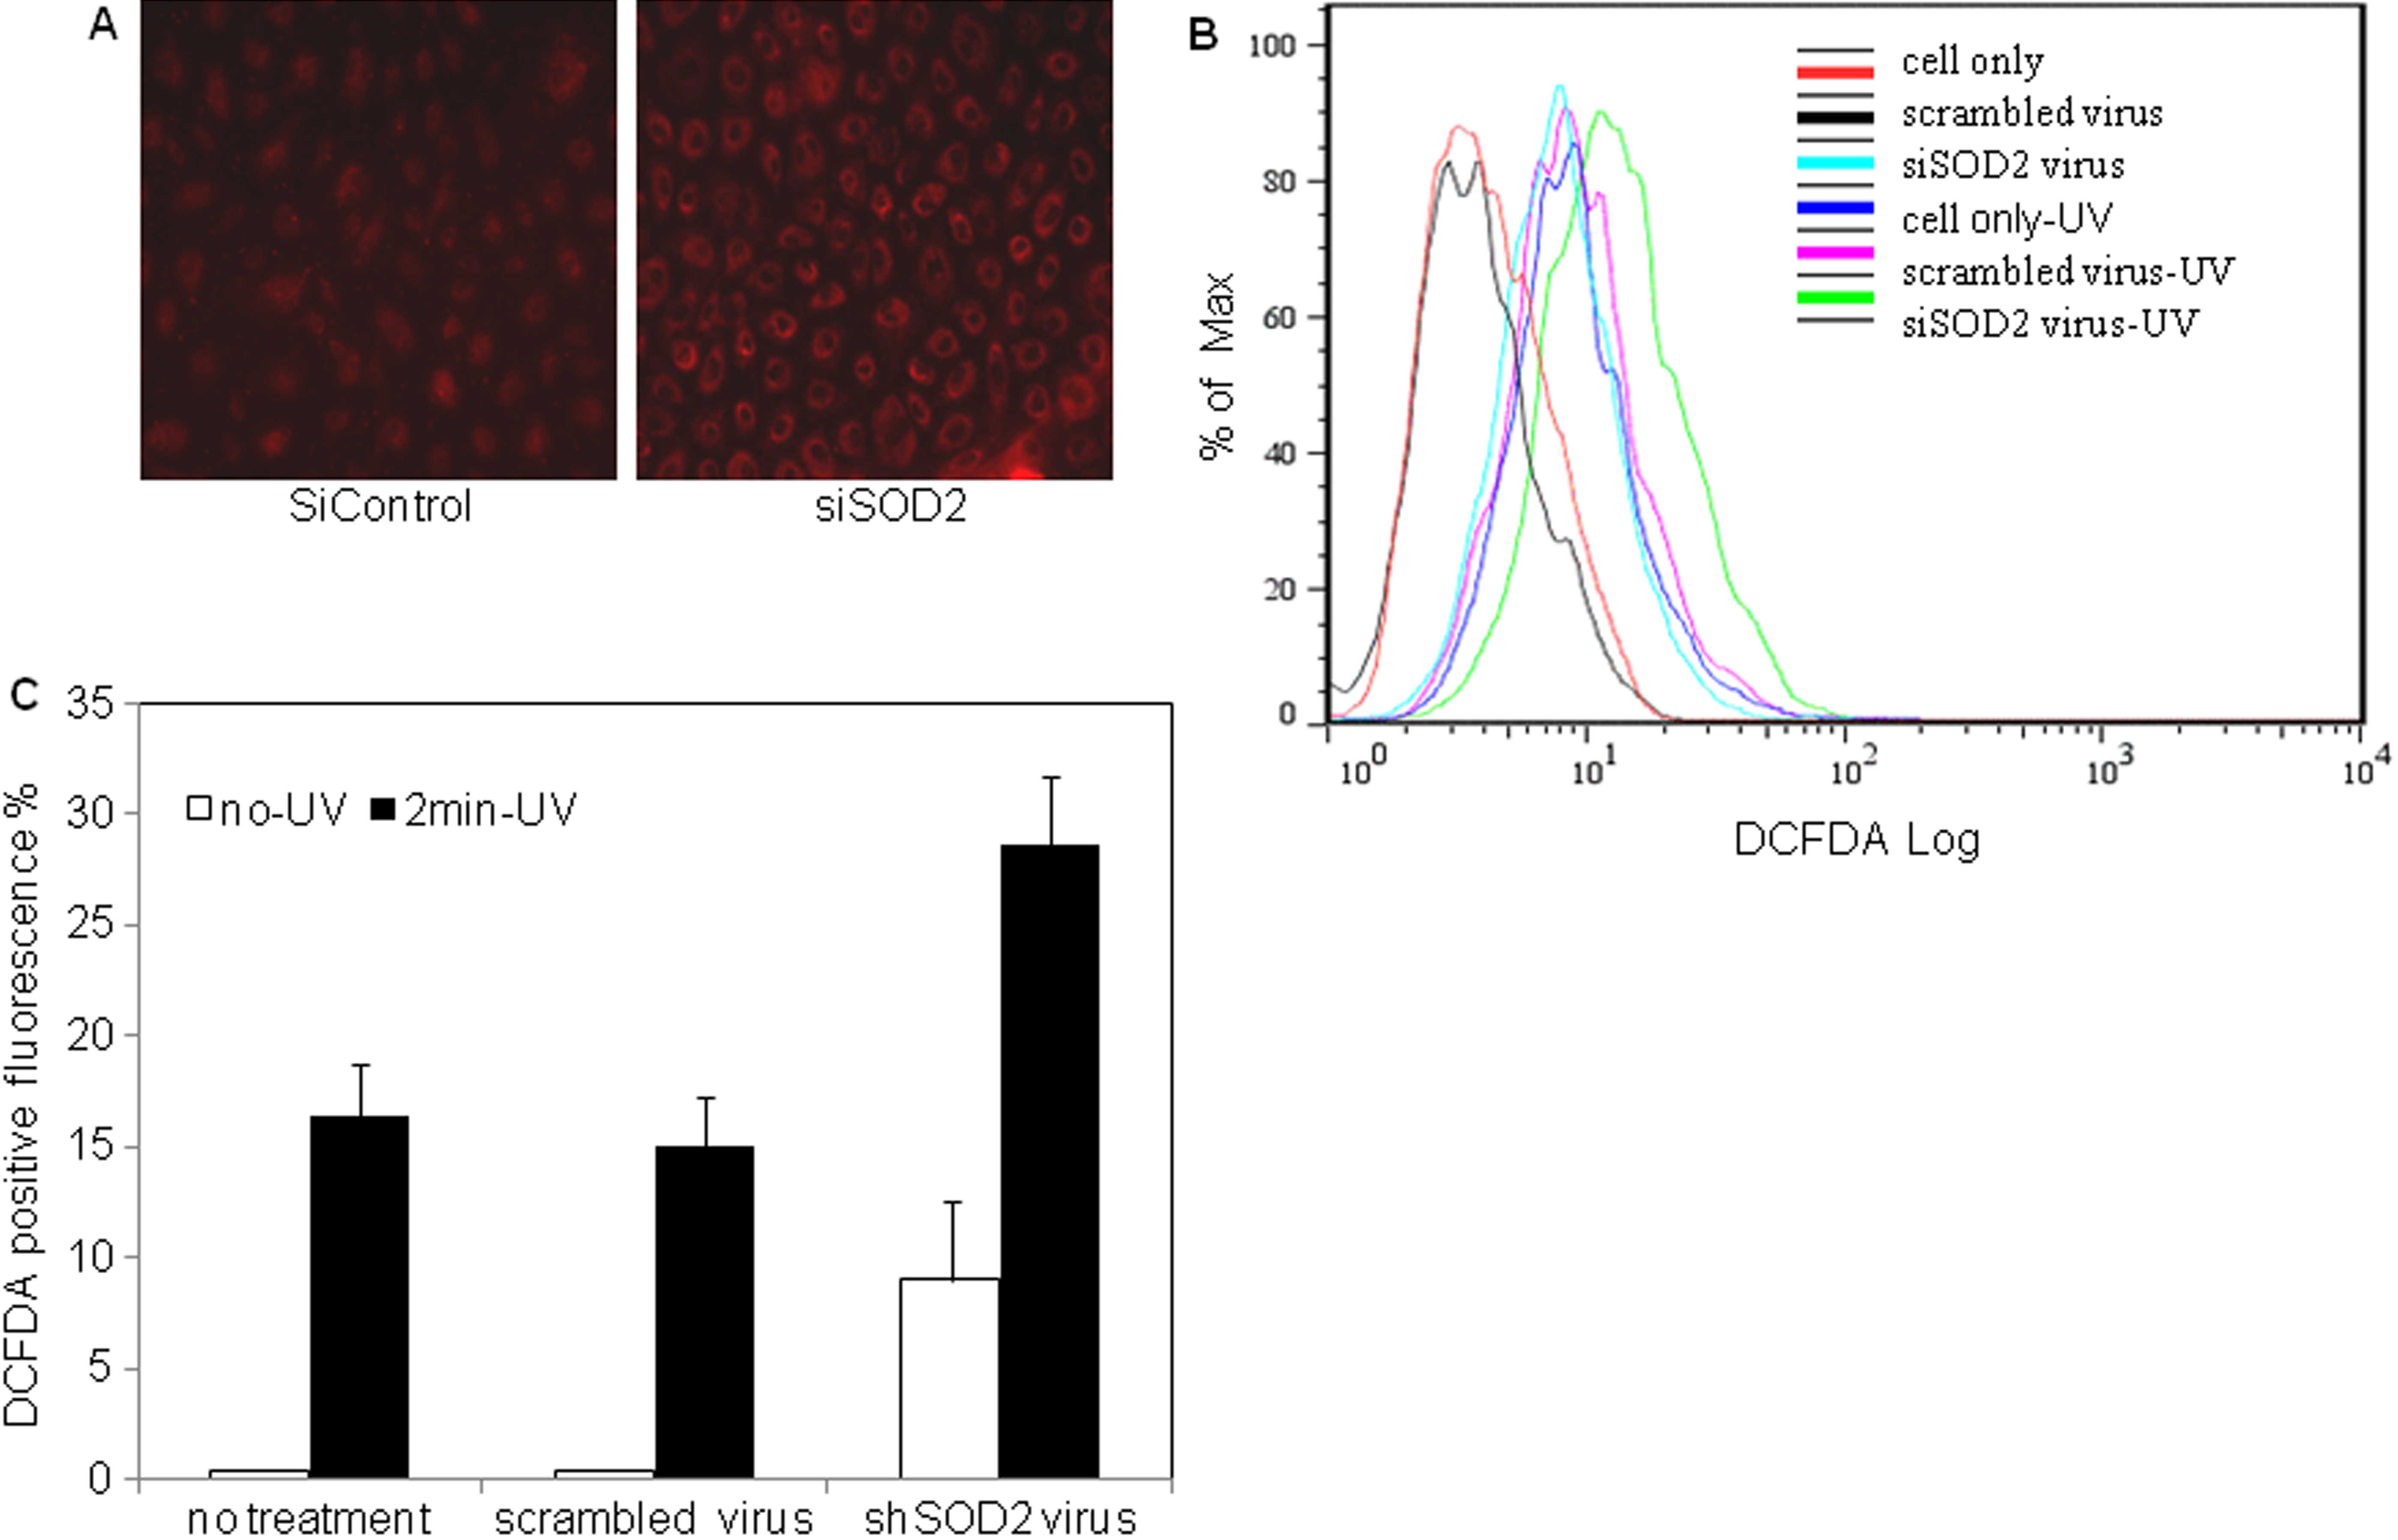
 Figure 4
of Liu, Mol Vis 2011; 17:2473-2481.
Figure 4
of Liu, Mol Vis 2011; 17:2473-2481.