Figure 1 of
Liu, Mol Vis 2011; 17:2473-2481.
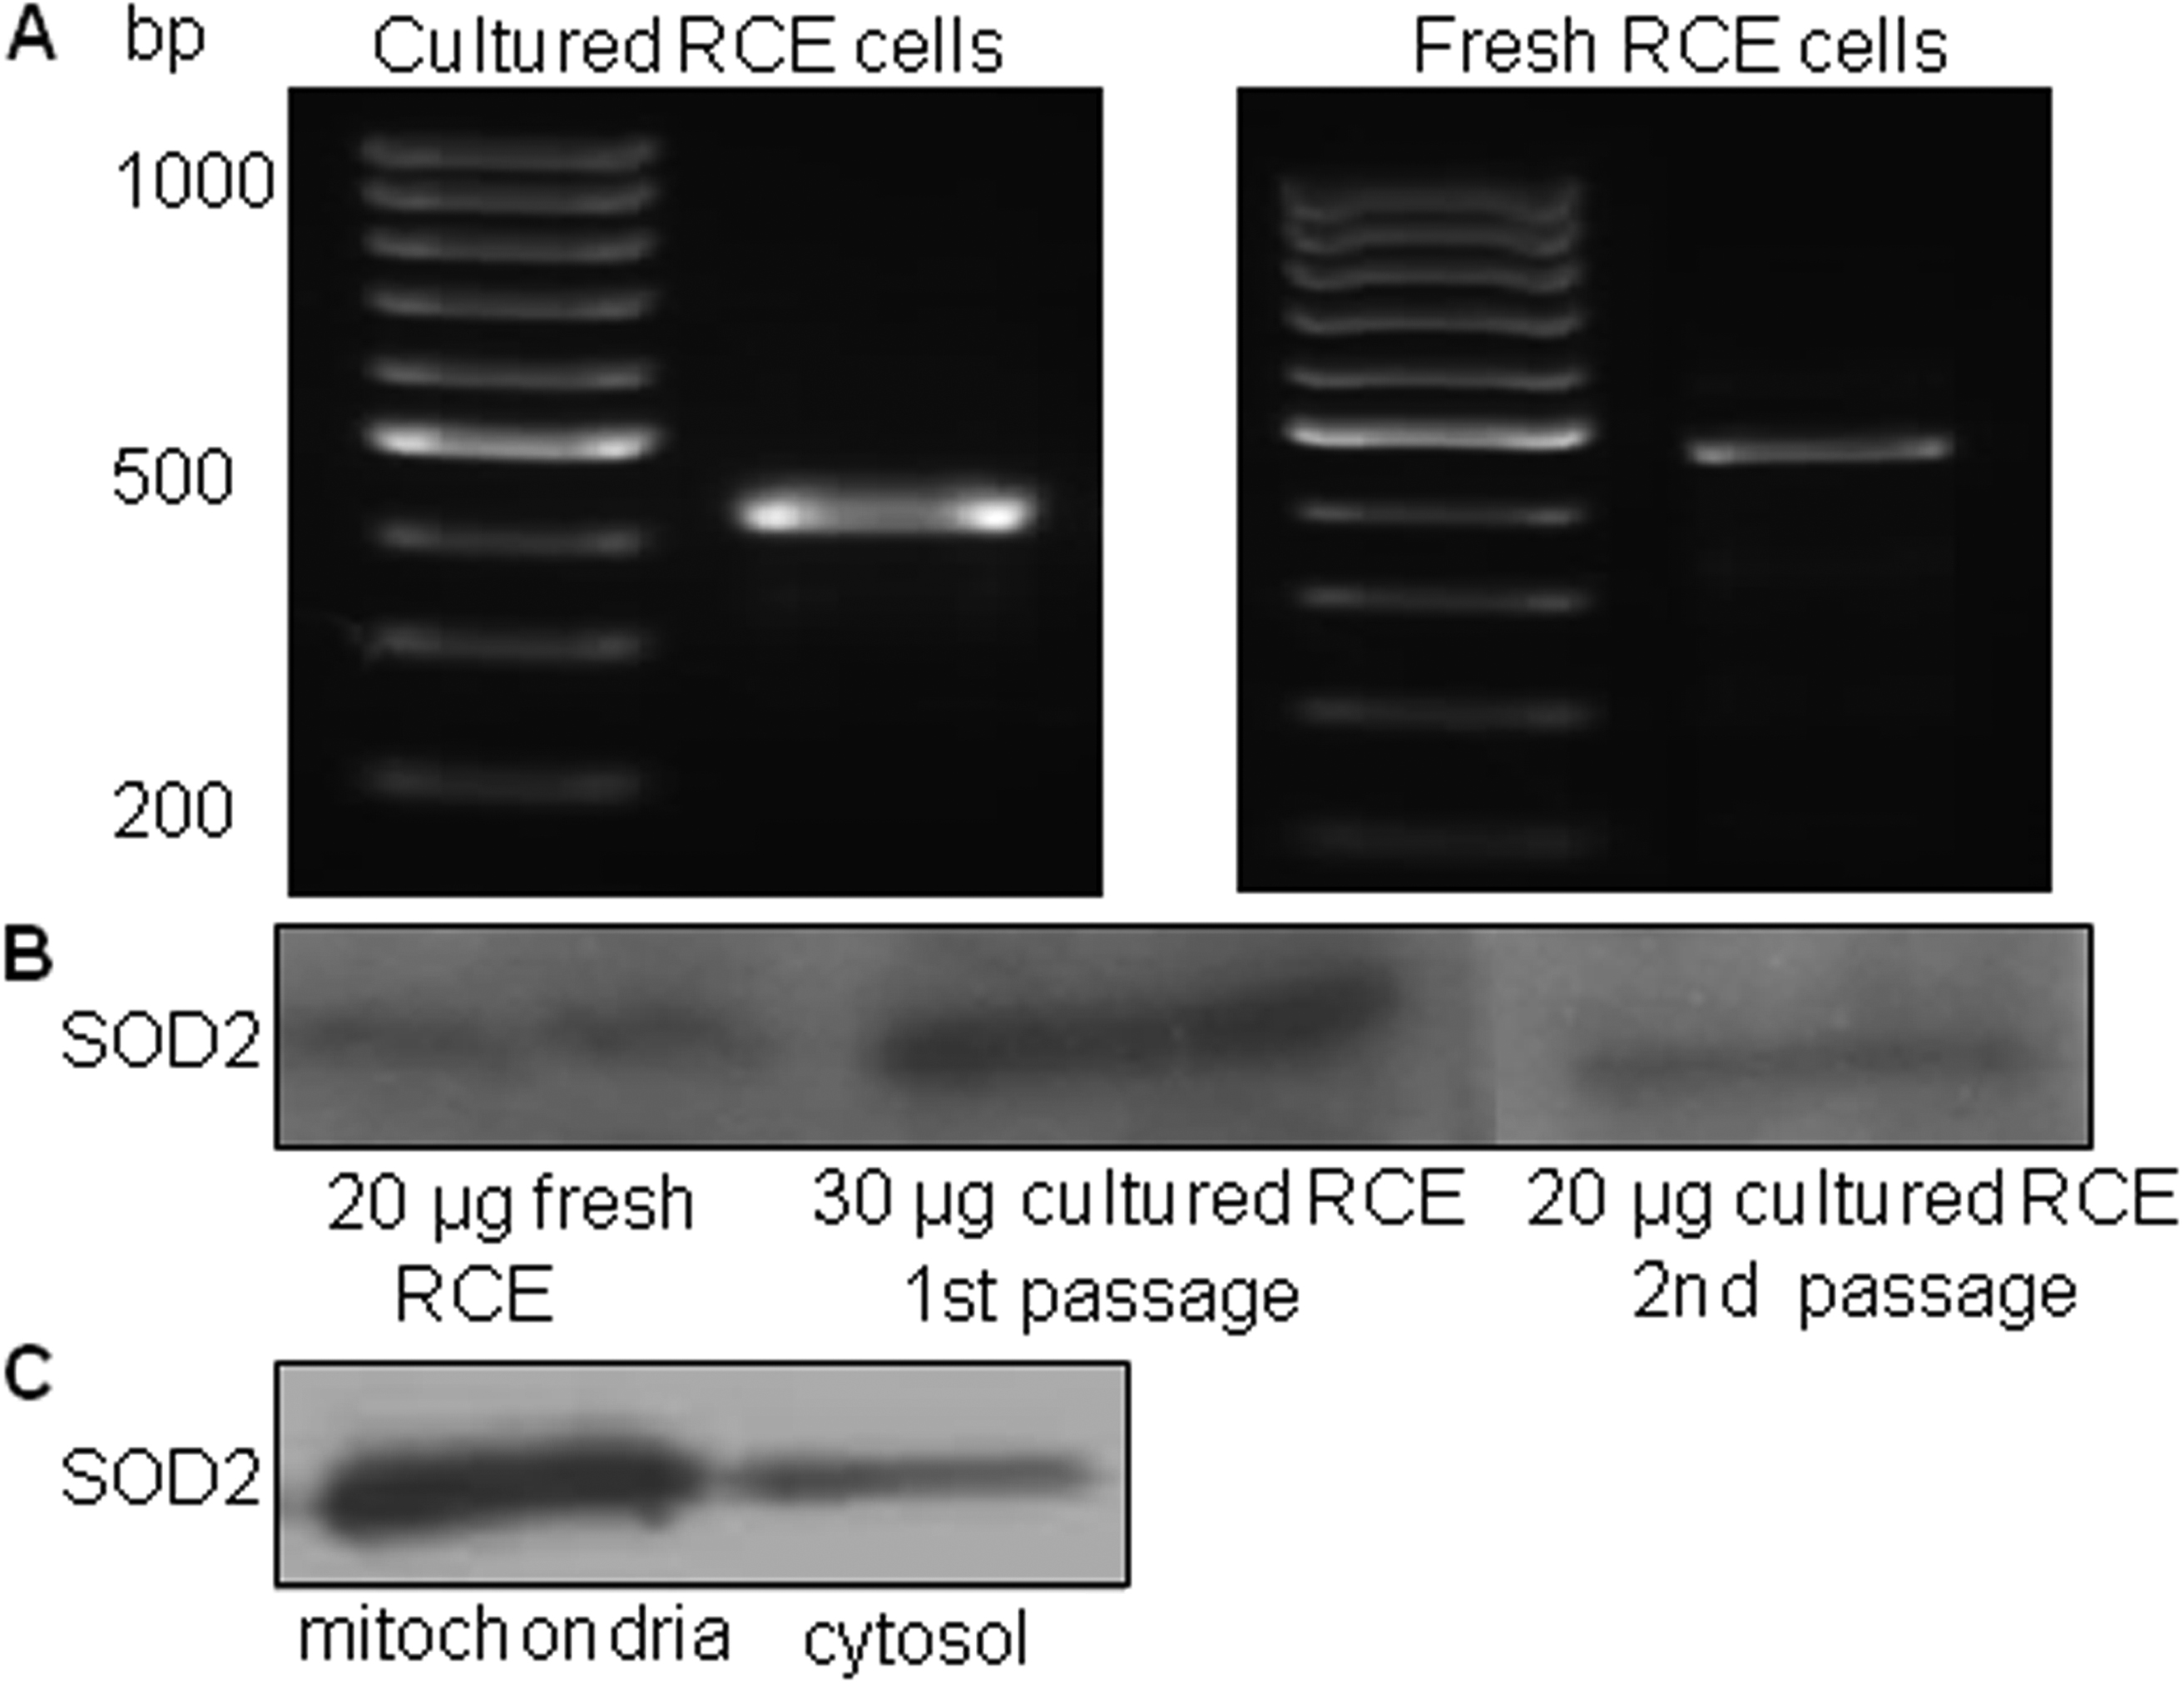
Figure 1.
SOD2
expression in RCE cells.
SOD2
expression was examined by RT–PCR (
A
) and western blot analysis (
B
). SOD2 abundance was compared in mitochondrial and cytosolic fractions by western blot (
C
). A dilution of 1:1,000 of anti-SOD2 was used.
 Figure 1
of Liu, Mol Vis 2011; 17:2473-2481.
Figure 1
of Liu, Mol Vis 2011; 17:2473-2481.