Figure 7. Partial correlation
analysis and modeling of genes with expression in the eye that
are modulated by Tyrp1 or Myo5a in the heatmap.
A: Summary table showing partial correlation coefficients
and corresponding p values for all relationships. B:
Composite model showing all Pearson correlation coefficients.
Circular lines indicate cis-eQTLs. Linear lines indicate direct
regulation of one gene by another. Edges that connect Myo5a
directly to other genes/transcripts such as Tyr are
labeled with the values of the partial correlation that removes
the effects of variation in Tyrp1.
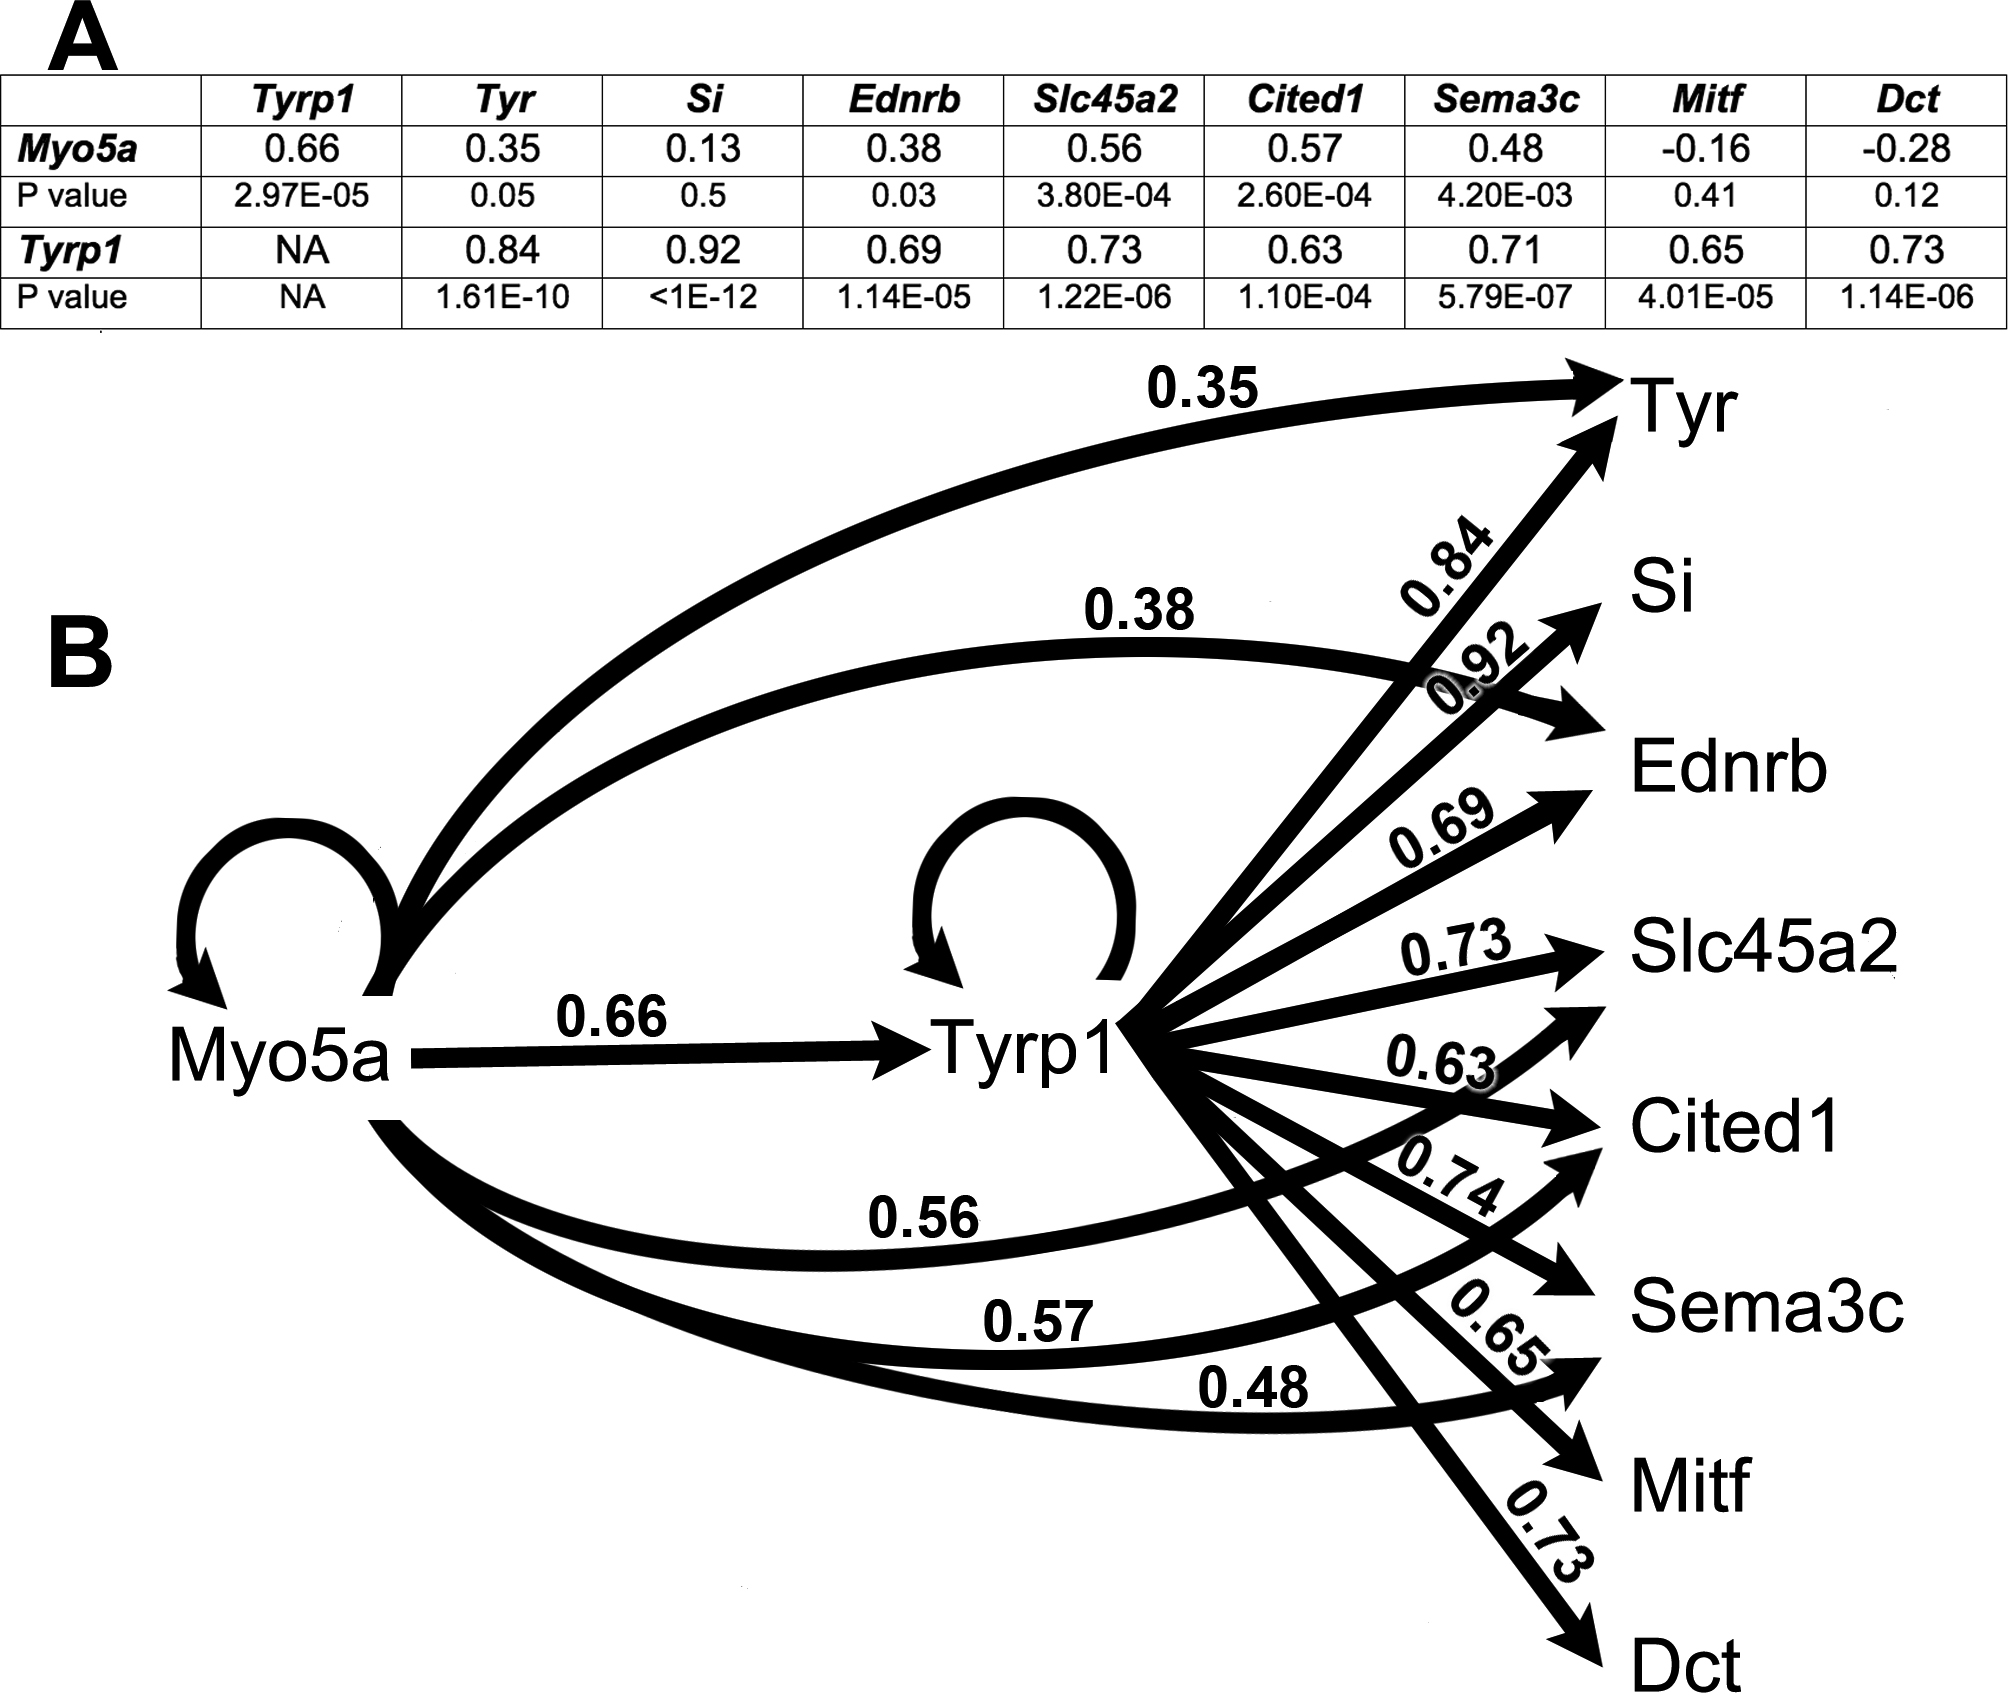
 Figure 7
of Lu, Mol Vis 2011; 17:2455-2468.
Figure 7
of Lu, Mol Vis 2011; 17:2455-2468.