Figure 6. Heatmaps of Tyrp1 covariates taken from the GO categories achieving statistical significance in the wildtype data set. A: In the combined data set, both Tyrp1 and Myo5a are cis-eQTLs on chromosome 4 and 9, respectively. The red and blue bands at these same locations indicate which other genes
are likely regulated by Tyrp1 and Myo5a. B: In the data set comprised of RI lines with wildtype Tyrp1, the band on chromosome 4 is not present because the expression level of Tyrp1 in these lines does not vary enough to be mapped. However, the band on chromosome 9 remains and is enlarged, suggesting that
Myo5a influences the expression of multiple genes in the heatmap. C: In the data set comprised of lines with mutant Tyrp1, Myo5a remains as a cis-eQTL but all other associations are absent. The orange triangles indicate where each gene is located in
the genome. Red or blue bars indicate where each gene maps.
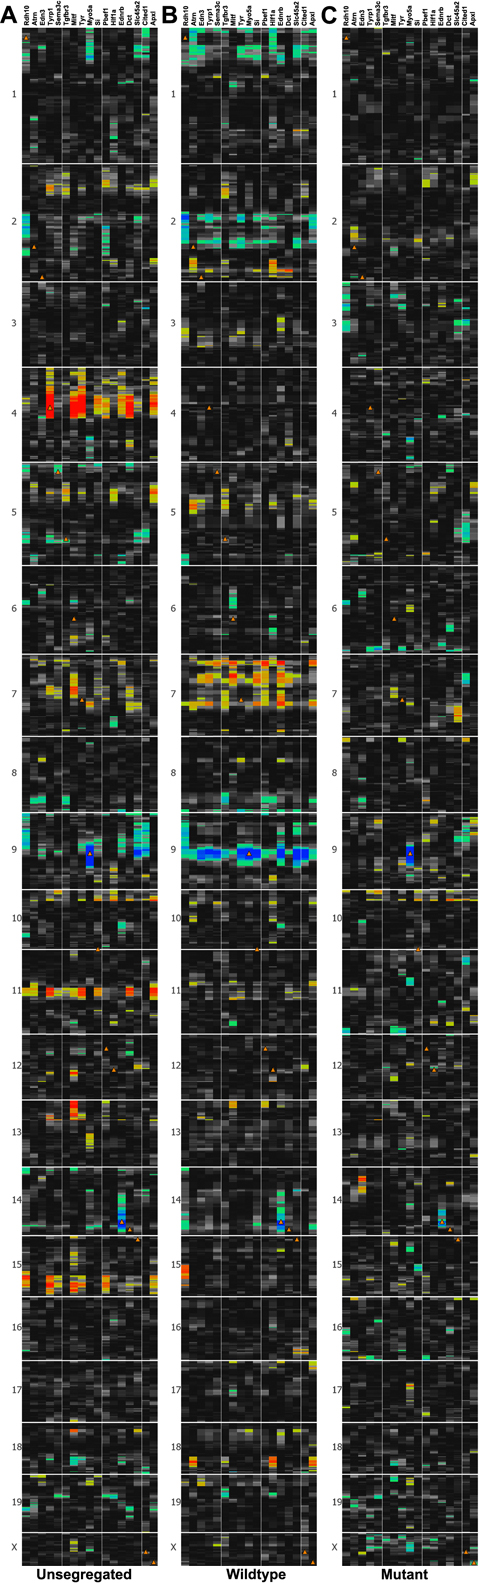
 Figure 6 of
Lu, Mol Vis 2011; 17:2455-2468.
Figure 6 of
Lu, Mol Vis 2011; 17:2455-2468.