Figure 5. Genetic network
co-expression graphs. A: Genetic coexpression network
generated from genes correlated with wildtype Tyrp1
shows that the expression level of Tyrp1 was directly
linked to all nodes in the network with an r value of ≥0.5.
Moreover 94% of the genes function in mesenchyme development
and/or melanin/pigment production. B: A similar network
generated using the same 17 genes and expression levels from the
mutant database indicates that the expression of Tyrp1
is correlated with only six genes in the network and the tight
cohesive nature of the network is lost. C: Genetic
coexpression network generated from genes correlated with mutant
Tyrp1 shows that the expression level of mutant Tyrp1
was directly linked to only six nodes at r≥0.7. The remaining
associations occurred through intermediate links. Only 8% of the
genes in the network function in melanin/pigmentation pathways
and only 6% function in mesenchyme development, the two top
biologic function categories associated with wildtype Tyrp1.
●=melanin/pigmentation pathway; ■=mesenchyme development;
▲=other biologic function. Each transcript is shown as a node
and Pearson correlation coefficient values are indicated as
lines between nodes. Bold and thin lines reflect coefficients of
1.0–0.7 and 0.7–0.5 respectively. Red/orange and blue/green
colors indicate positive and negative correlation coefficients,
respectively.
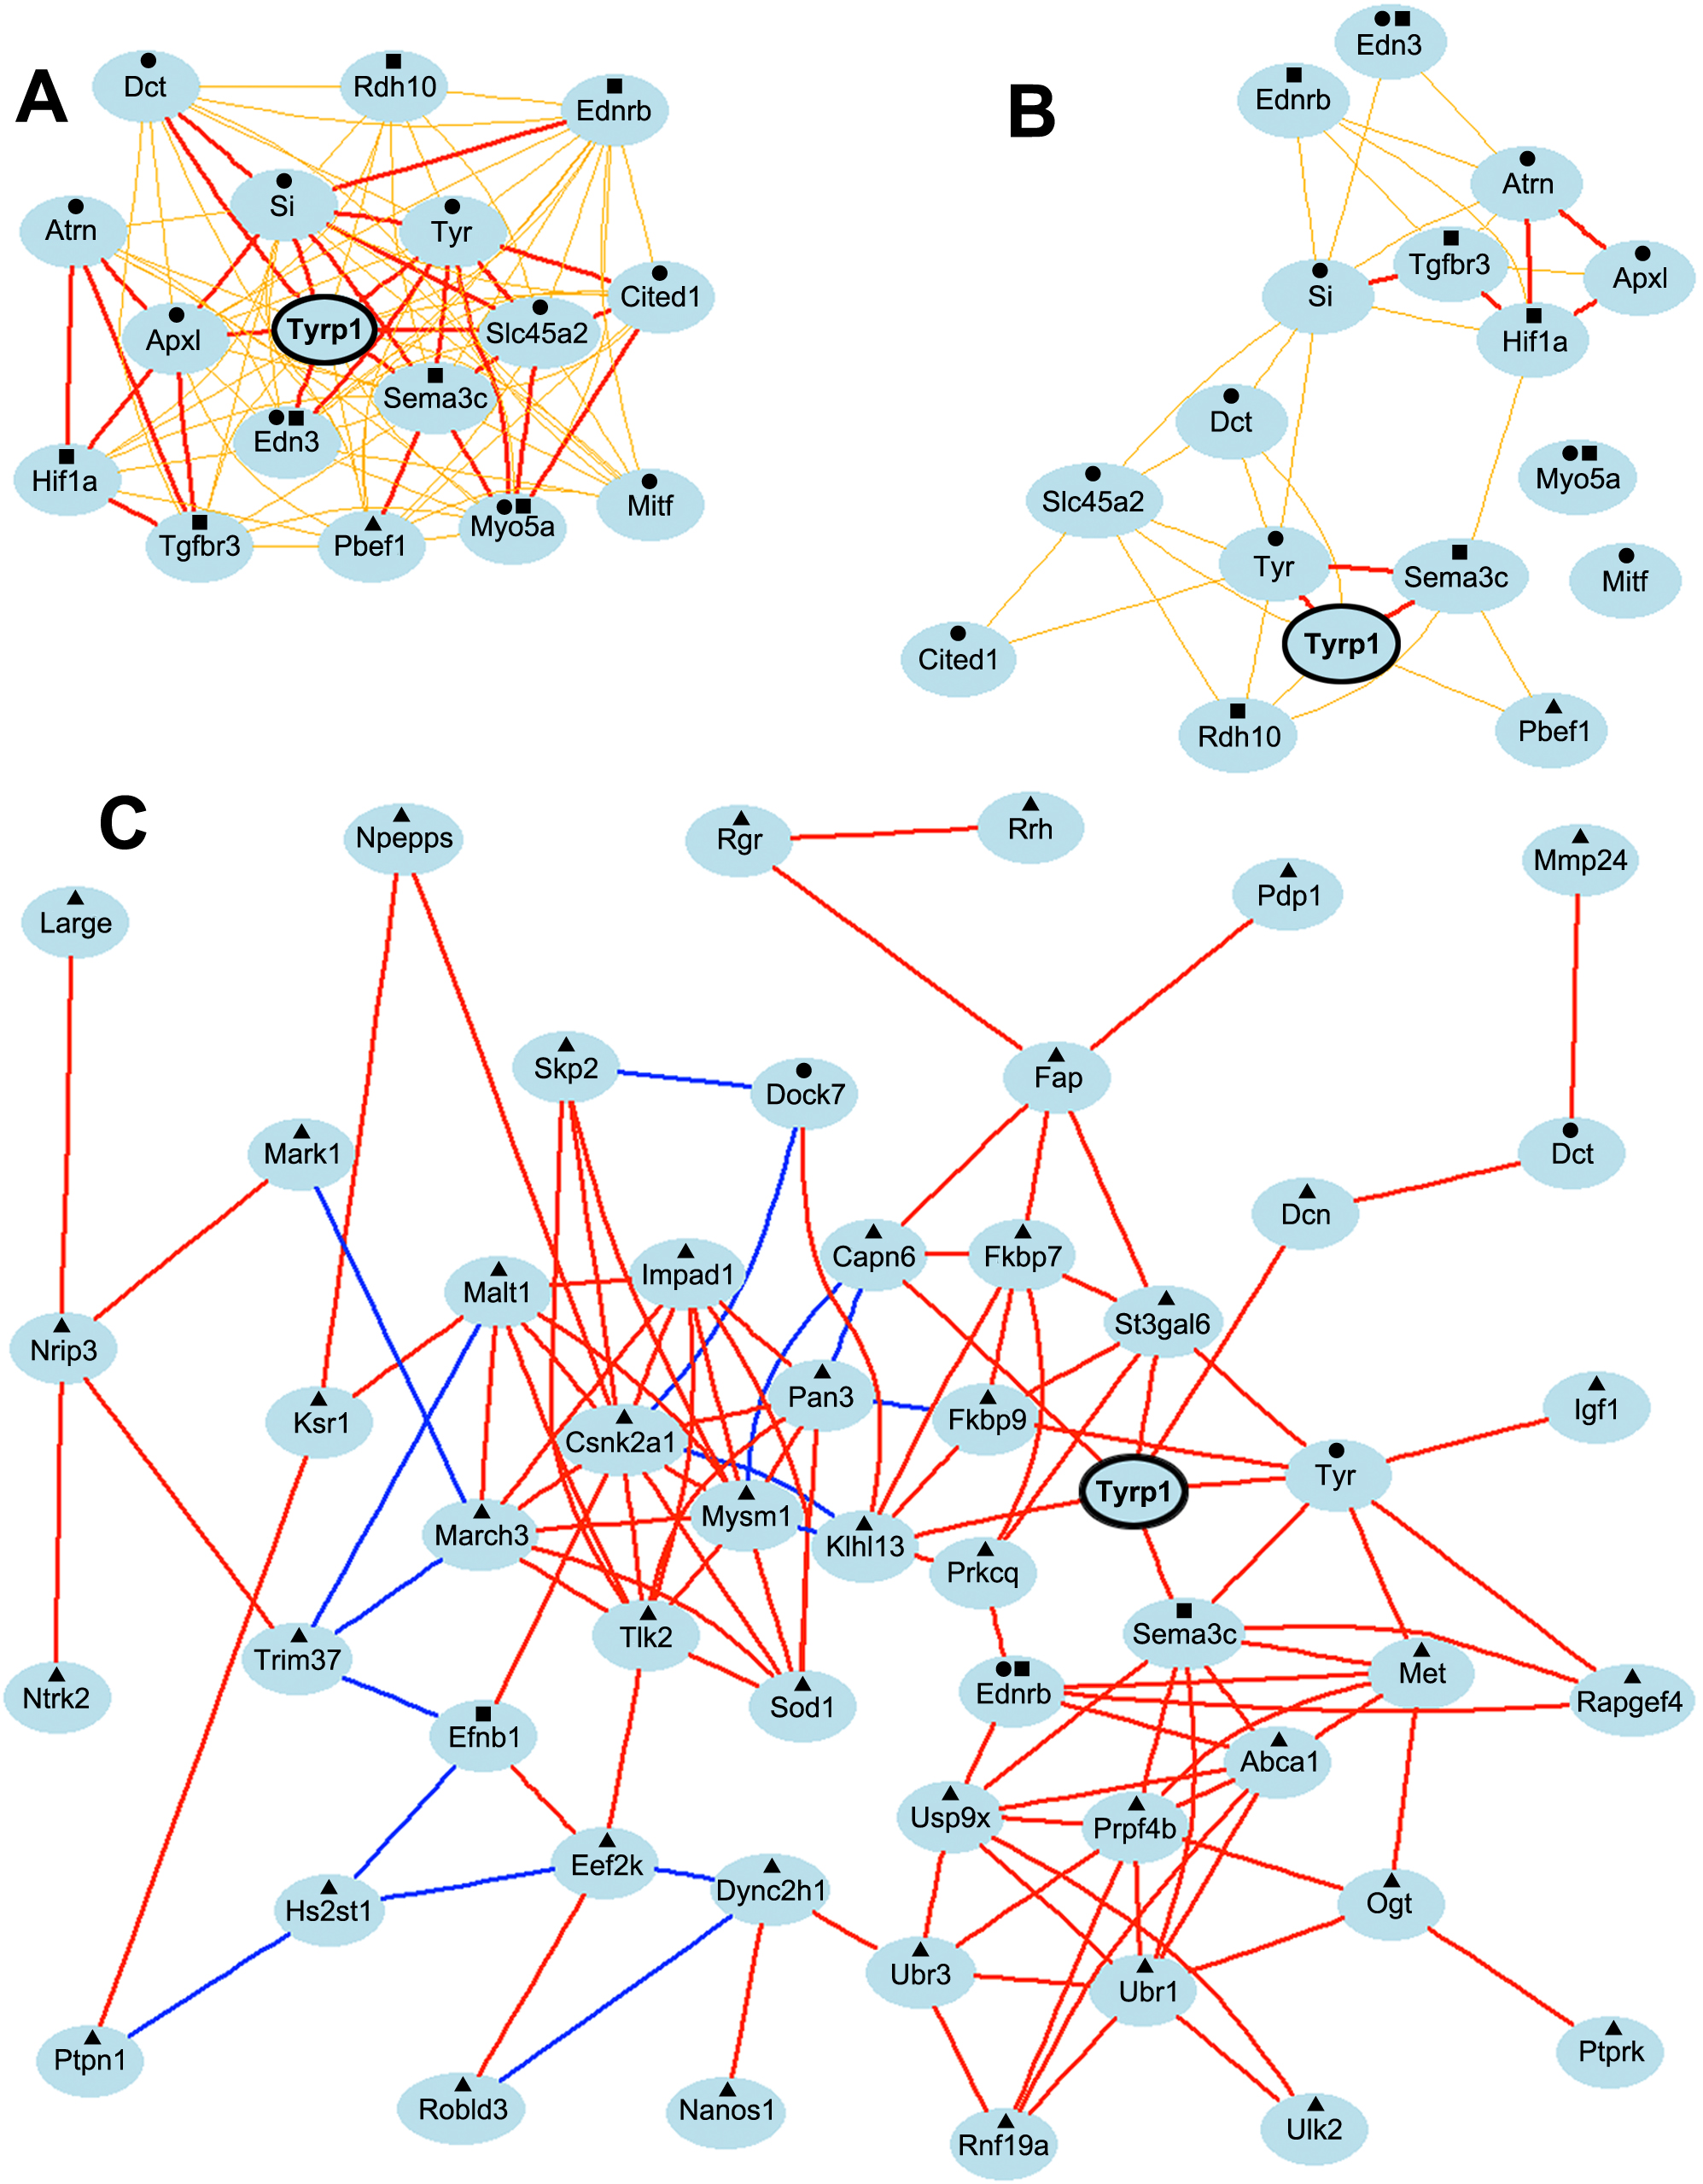
 Figure 5
of Lu, Mol Vis 2011; 17:2455-2468.
Figure 5
of Lu, Mol Vis 2011; 17:2455-2468.